Introduction Climate Emergency
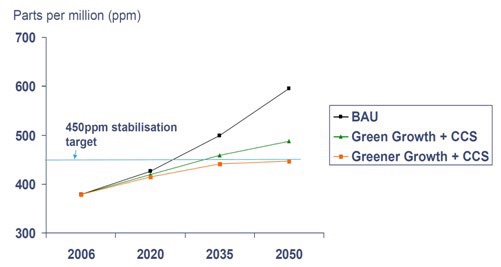
UN secretary-general antonio guterres urged all countries to declare climate emergencies in his speech at the Climate Ambition Summit and asserted that more must be done to hit net-zero emissions (Reuters, 2020Reuters. (2020). U.N. chief urges leaders of every country to declare “climate emergency”.). He explained that global warming has already become an emergency issue, and all nations must take action. This is indeed an urgent issue, but will the wish of the UN Secretary-General come true? The answer is no, not with today`s measures, theory, and understanding being without a holistic view of the mechanism of global warming. Figure 1 shows that decarbonization measures developed so far will not be sufficient, even with carbon capture and storage (CCS). This data means a missing part in the big puzzle of sustainable decarbonization, which the Secretary-General alludes to. Current global warming data has a complete picture of the level of CO2 content in the atmosphere (Figure 1), but overall potential solutions are not wholly recognized due to today`s limited understanding of the root causes of CO2 emissions. Figure 1 is sad proof that the wish of net-zero carbon will never come true unless a holistic picture of the root causes is drawn.
CO2 Emissions, Humidity, and Ozone
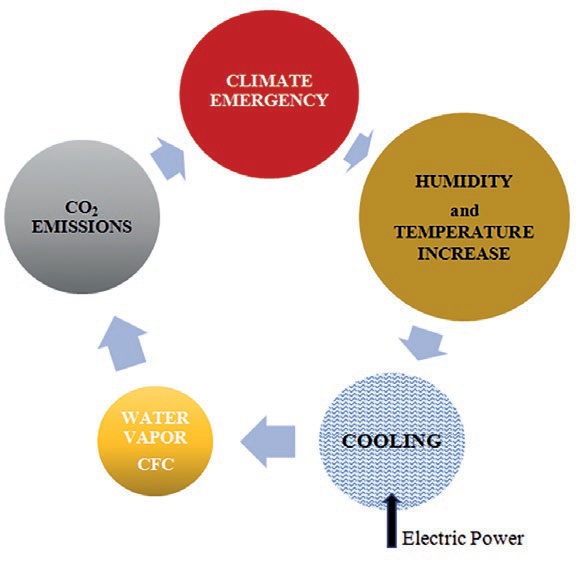
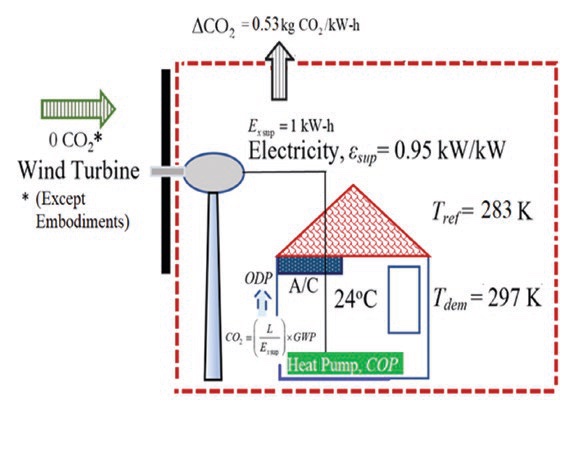
According to the Author, Figure 2 shows the direct relationships between the climate, atmosphere, global warming, humidity, comfort, and ozone depletion. Consider a green energy system like a wind turbine or PV. Once the electricity is generated, it is important to trace downstream how it is utilized from an exergy point of view. For example, if this “green” electric power is used in an electric radiator for indoor comfort heating at 20oC (293 K), the unit quality (exergy) of useful work demand, εdem, for heating may be calculated according to the ideal Carnot cycle:
Here, 273 K (0oC) is the reference environment condition. On the other hand, electricity is a very high-quality energy source with a unit supply exergy, εsup of 0.95 kW/kW. This means that most of the useful work potential of the generated electric power is destroyed:
The exergy rationality of using wind or solar energy in comfort heating will be only 0.07 (0.068/0.95).
This amount of irreversibly destroyed exergy (lost opportunities for useful work) must be offset by someone, somewhere, and most likely by fossil fuels. This causes more “unseen” CO2 emission from “green power”:
This result shows that although there is not a direct CO2 emission source in this example (except in manufacturing, installation, etc.), exergy destructions are responsible for large amounts of additional emissions, which are almost equal to the emissions from a natural gas condensing boiler that we can directly measure and see.
These additional emissions due to exergy destructions are unseen and are only revealed in the global warming temperatures. In other words, these emissions are observed in the global warming context but remain unexplained and unsolvable unless the exergy concept is recognized by scientists and engineers.
According to another research study by the Author, which mathematically relates nearly avoidable CO2 emissions to exergy destructions (Kilkis, 2021aErten, D., & Kilkis, B. (2021). How can green building certification systems cope with the era of climate emergency and pandemics? Manuscript submitted for publication.), for every destroyed exergy, the global temperature is estimated to increase by a rate of 0.256 x 10⁻¹³K/kW-h. If, for example, 2 x 10¹³ kW-h/year is a stable number of annual electric power generation using fossil fuels, it is estimated that exergy utilization rationality in the energy sector will rise to 0.8 in the coming decades;
∆CO2 = 0.256 x 10⁻¹³K/kW-h x 2 x 1013 x (1-0.8) = 0.1 K/year As this estimation shows, the unseen part of emissions is responsible for about 0.1 K global temperature rise, and all decarbonization measures must be revised accordingly by taking into account the exergy destructions.
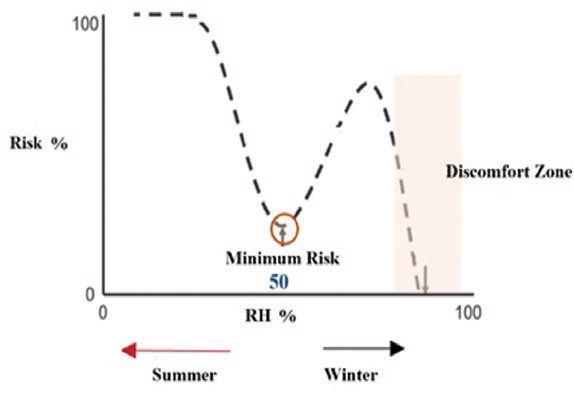
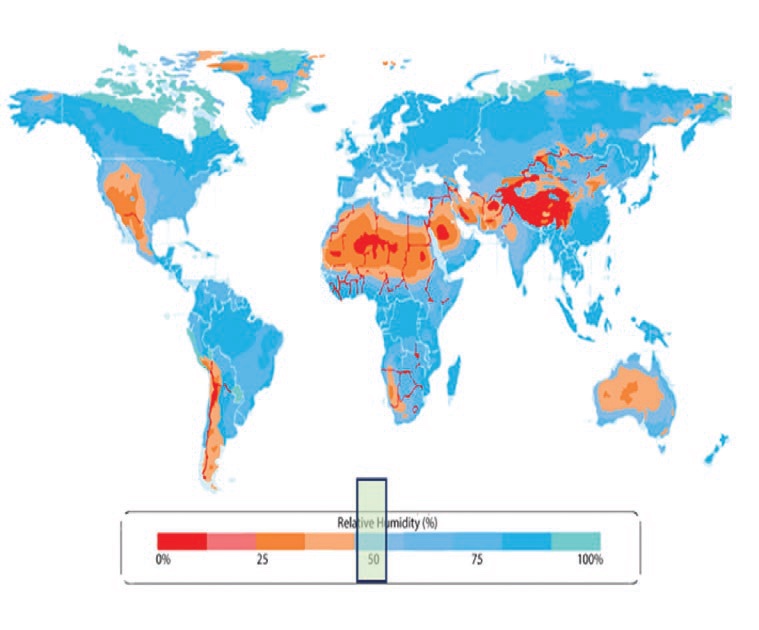
Figure 4 shows that most of the world is too humid while some parts are too dry. There are almost no places with ideal RH values. For example, Turkey and other countries on the Belt and Road are in the humid zone, whereas China is not. These figures may partly account for the regions where the pandemic is strongest. Humidity is related to global temperature and CO2 emissions.
Climate Emergency and Virus Infections
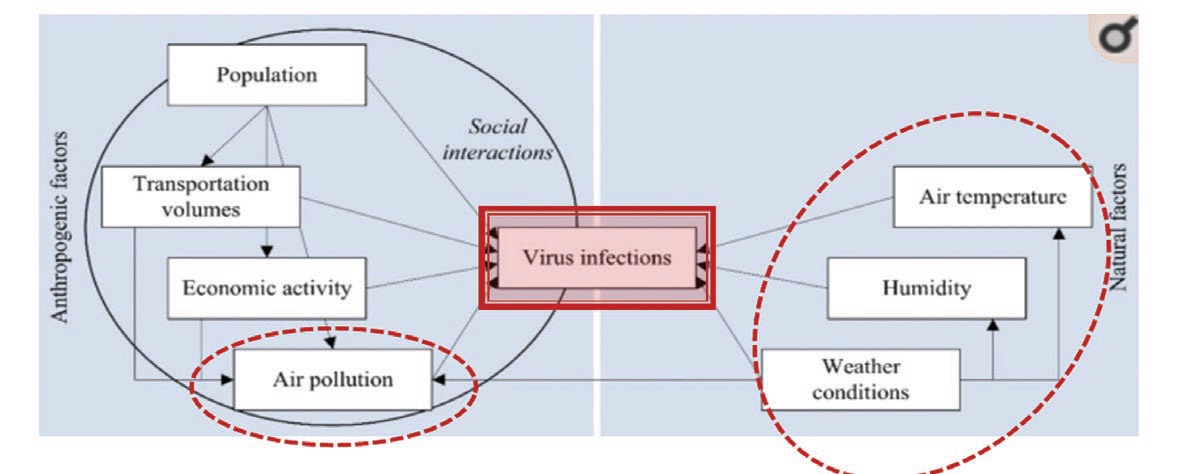
There are already qualitatively established correlations between the air temperature, humidity, and other adverse weather conditions in addition to the well-known, well-observed air pollution on the anthropogenic side of the equation. Unfortunately, there has been little quantitative modeling about virus infections and the climate emergency elements so far. That is the main reason to develop a mathematical model, which is expected to guide scientists towards further understanding the mathematics of such a direct link.
A Green Building May Not Be COVID-19 Safe
Buildings are both energy-intensive and coronavirus-intensive. We spend about 90%, even more with pandemic isolation measures, of our time indoors. Buildings, especially with 100% fresh air requirements against COVID-19 spread, are responsible for approximately 45% of total energy consumption (Cao, Xilei, & Liu, 2016Cao, X., Xilei, D. & Liu, J. (2016). Building energy-consumption status worldwide and the state-of-the-art technologies for zero-energy buildings during the past decade. Energy and Buildings. 128.; Tokazhanov, et al., 2020Tokazhanov, G., Tleuken, A., Guney, M., Turkyilmaz, A., Karaca, F. (2020). How is COVID-19 experience transforming sustainability requirements of residential buildings? Sustainability, 12, 8732.).
Such a high level of energy consumption means exceptionally high CO2 emission responsibilities, and the green energy they may use may not be green, depending upon the energy usage. For example, the Chinese government considers reducing CO2 emissions in cold rural areas by replacing local coal and lignite stoves and boilers with local wind turbines. A preliminary study (Kilkis, 2021bErten, D., & Kilkis, B. (2021). How can green building certification systems cope with the era of climate emergency and pandemics? Manuscript submitted for publication.) revealed that the direct use of wind energy for heating, even with heat pumps, is not rational as claimed by the 1st Law. The refrigerant leakage from a heat pump also has a ΔCO2 -equivalent ozone depletion effect. For each kW-h of wind electricity supply, the emission responsibility based on R32 refrigerant with a global warming potential (GWP) of 677 and an assumed leakage rate, L of 1.7 x 10⁻⁴ kg/h, is calculated as follows:
On the other hand, for a lignite stove with εsup = 0.8 kW/kW for lignite and an efficiency of 0.35 without any ozone depletion potential (no refrigerants), ∑CO2 is only 0.26 kg CO2/kW-h of heat supply. Therefore, although the 1st Law indicates almost zero CO2 responsibility with COP =3, the 2ⁿd Law shows that the nearly avoidable emissions responsibility is 2.5 times.
The Need for the Present Study
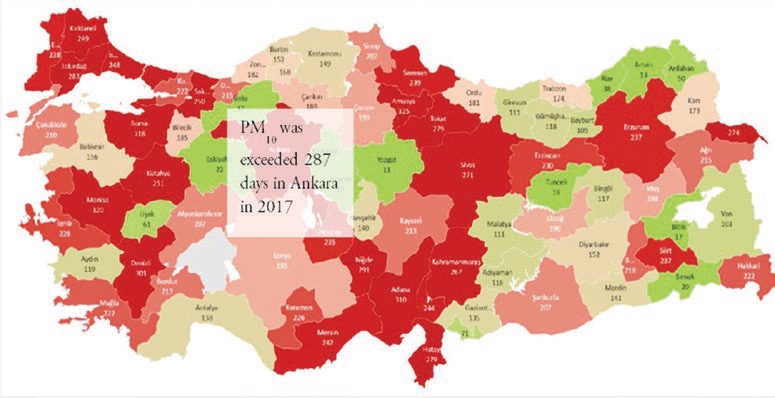
The importance of such preliminary data is that in many countries, including Turkey, exceedances are high. PM10 means the amount of particulate matter with diameters less than or equal to 10 micrometers (0.01 mm) in the air (EPA Victoria, 2021EPA Victoria. (2021, March 16). PM10 particles in the air.). It needs to be officially monitored hourly, year-round. A good air quality corresponds to less than 40 PM10 µg/m3 averaged over 1 hour. WHO limits this value to 20 PM10 µg/m3. Any exceedance over this limit has several health risks depending on the amount recorded; if PM10 µg/m3 averaged over 1 hour is above 300, then the air quality is extremely poor. For example, in Ankara PM10 limits were exceeded 287 days out of 365 days in a year. This value is a clear indication of the severity and urgency of the case.
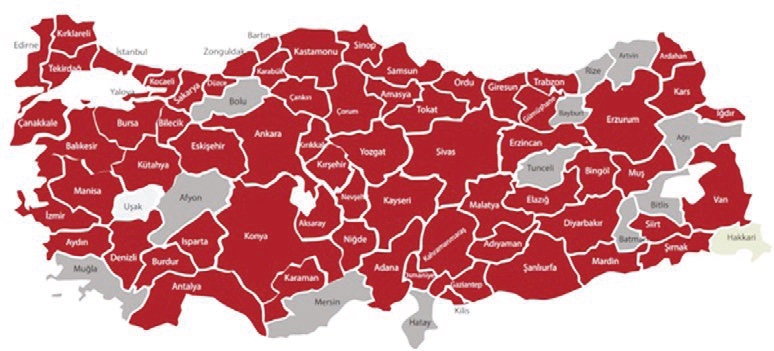
According to Figure 10, only the province of Hakkari does not exceed 50 PM10 µg/m3 more than 35 times a year. All other provinces exceed this limit annually, and the limit of 50 PM10 µg/m3 is a quite high value, already corresponding to short-term unhealthy conditions, especially during the pandemic period. Grey areas are provinces where measurements are not available for more than 75% of the year.
The Correlation Model
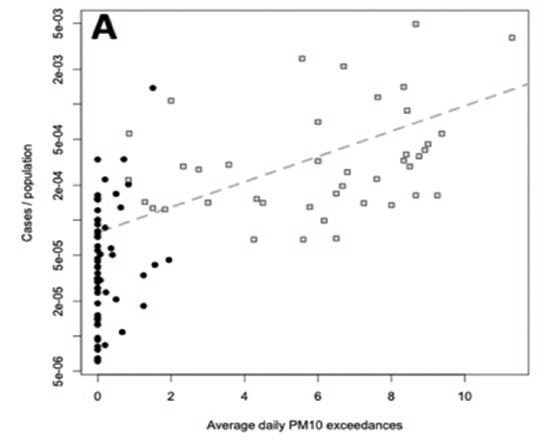
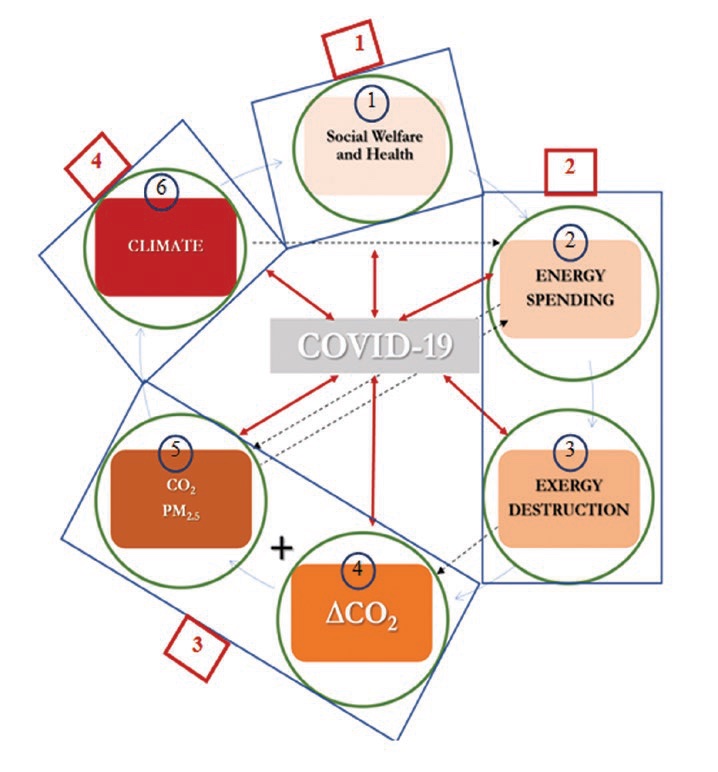
A model was developed based on initial data from Italy about daily COVID-19 cases per thousand people as a function of PM10 and PM2.5. The difficulty in adopting their correlations to CO2 versus COVID-19 cases was their unavailability. Therefore, it was necessary first to establish a relationship between PM values and CO2 emission values. This is the first step in determining all the interrelations among four conflicting factors (Quadrilemma) and six vectors. The rest of the interrelationships are already available, known, or more easily determinable. Recently, the COVID-19 pandemic became a bilateral relative with all of them (See Figure 11). Therefore, it is time to include the concept of “Pandemic Resistant Buildings” to the green metrics under a broadened title of safe buildings.
PM is related to CO2 emissions now, which is shown in Figure 12 and the following linear relationship in terms of the average conversion mapping factor, f . For example, for marine diesel engines, the proportion of PM2.5 to CO2, namely the f factor, is 0.002 by weight. In coal or lignite-fired power plants, this ratio is about 0.1. Therefore, as long as fossil fuels will be kept in diminishing use in several sectors, ΔCO2, which has remained unaccounted for so far, is an important factor in pandemic risk.
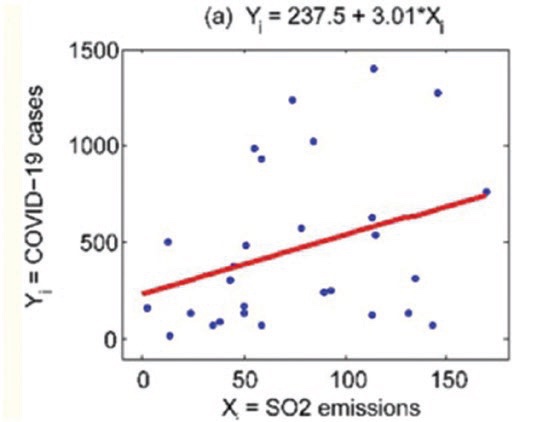
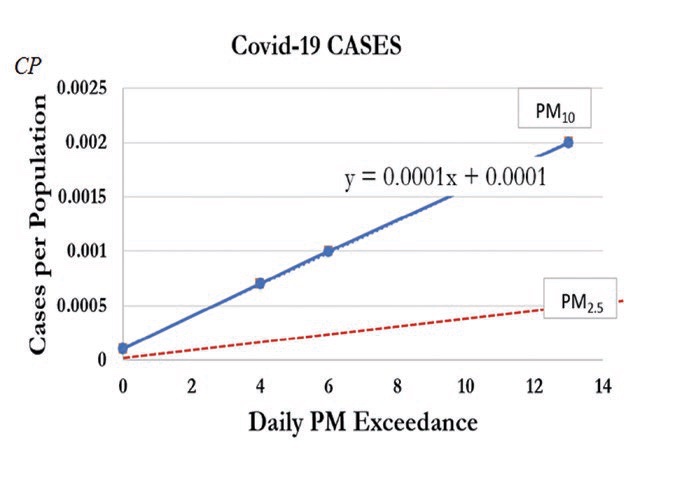
An estimate for the factor f may be approximated to be 0.06 by weight. This means that 1 kg ΔCO2 is responsible for an increase of 0.06 kg PM2.5 increase. Depending on the limits of the local maximum number of daily exceedances, the potential COVID-19 case increase per population in that locality may be estimated. For such an endeavor, current medical reports, which are shown in Figures 8 and 9, were used.
Daily exceedance of CO2 from local air quality measures may be determined. The exceedance limit may be established by local and national authorities. For example, if the exceedance limit is 300 ppm in a given district and CO2 concentration exceeds this limit 22 times, then CP is 0.0002, meaning two more cases in a population of 10,000 due to CO2 exceedance. This is an additional number of cases over the particulate matter exceedances. If the CO2 level is always above the 300-ppm limit, then the upper case of an additional 25 cases per ten thousand population may be estimated. However, more data is needed to project the current exceedance correlation further.
Results and Discussions
It is known that changing climatic conditions will also have significant effects on human health, even increasing the death rate. Deaths and diseases associated with weather conditions may increase due to more frequent extreme climatic events. The increase in the number of consecutive very hot days will directly affect acute health problems, especially in the elderly and those with chronic cardiovascular or respiratory disease. The increased risk of flood will also change landscapes and the spread risks of communicable diseases due to infectious and/or new disease-causing microorganisms or vectors entering new environments. Also, due to climate change, there is an increased possibility of the spread of serious infectious diseases carried by insects such as zoonoses.
This research has developed an initial correlation between additional COVID-19 cases and local CO2 concentrations. This correlation may now be linked to buildings and their emission responsibilities because, currently, they are responsible for more than 45% of emissions due to the 100% fresh air requirement and increased time spent indoors. The work presented here is the first step of the ambitious research plan to complete the puzzle shown in Figure 11. This is paramount work that needs to be done by all nations, as the UN Secretary-General urged in the Paris agreement. If this goal is achieved in time, it will also reduce the risk of current and future pandemics.