Unprecedented Development
This year, XI jinping will obtain an unprecedented third term as President of China and General Secretary of the Communist Party of China (CPC). He is now China’s most powerful leader since Mao Zedong. Like Mao, Xi now has his own ‘body of political thought’ carrying his name as added to the Communist Party’s constitution after the 19th Party Congress at which Xi pledged to lead the world’s secondlargest economy into a “new era of international power and influence”. At a closing ceremony in the Mao-era Great Hall of the People, it was announced that Xi’s Thought on Socialism with Chinese Characteristics for a New Era had been written into the party charter: “The congress unanimously agrees that Xi Jinping Thought … shall constitute [one of] the guides to action of the party in the party constitution,” a party resolution stated (Li, 2017Li, C. (2017, September 27). China’s 19th party congress. Bro okings. duct/chinas-19th-party-congress/).
In the past 40 years, China’s growth has been phenomenal. And since the global financial crisis and the Great Recession of 2008-9 in the major capitalist economies, China has continued to close the output gap with the leading capitalist economies. China’s industrial output has risen from being about 70% of the US in 2008 to overtaking the US by a substantial margin to reach 140% by 2019. In those 12 years before the pandemic broke, China’s industrial output rose 150% while industrial production in the US rose just 25%. With 19% of the world’s population, no country has ever grown so fast – only India, with 16% of the world’s people, is close. Back in the early 1980s, three-quarters of the world’s people were better off than the average Chinese. Now only 31% are (Roberts, 2020aRoberts, M. (2020a). China: Three models of development. Austrian Journal of Development Studies, 37(1), 10-39.). In 2010, 87 countries had a higher per capita gross domestic product (GDP) than China, but 83 were lower. This is an achievement without precedent.
Even if China’s average real economic growth were to slow from hereon to about 5% a year instead of the near double-digit expansion of the past, the gap with the G7 economies would continue to narrow. China’s working population has now peaked, but there are still hundreds of millions of rural workers and peasants to be incorporated into the industrial machine; and China is still sucking up as much of the world’s raw materials as it needs to sustain its expansion (Roberts, 2020aRoberts, M. (2020a). China: Three models of development. Austrian Journal of Development Studies, 37(1), 10-39.).
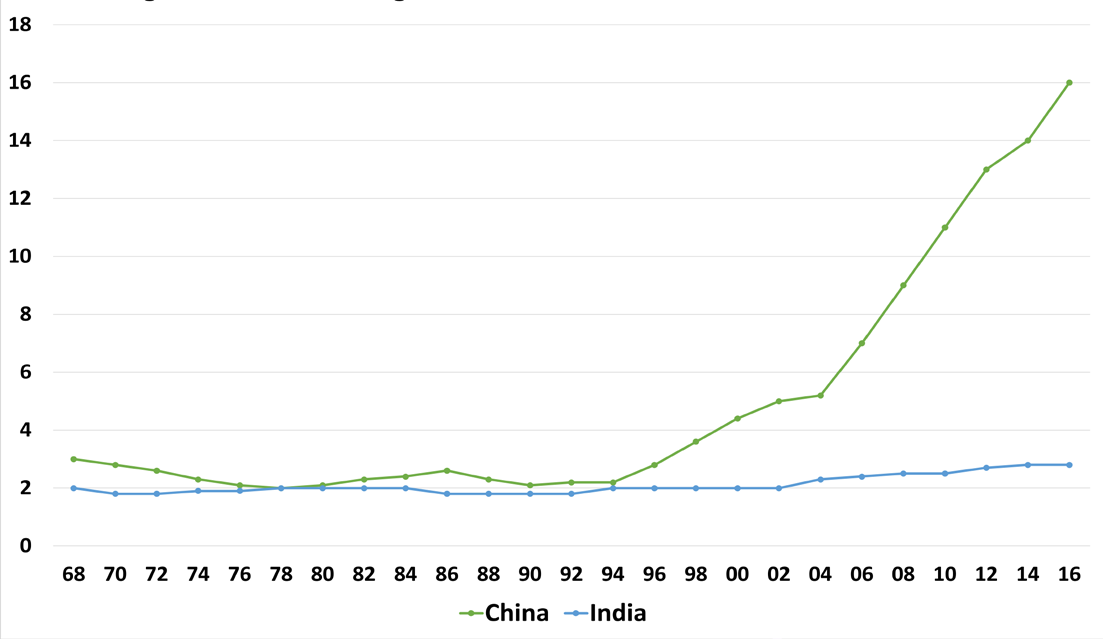
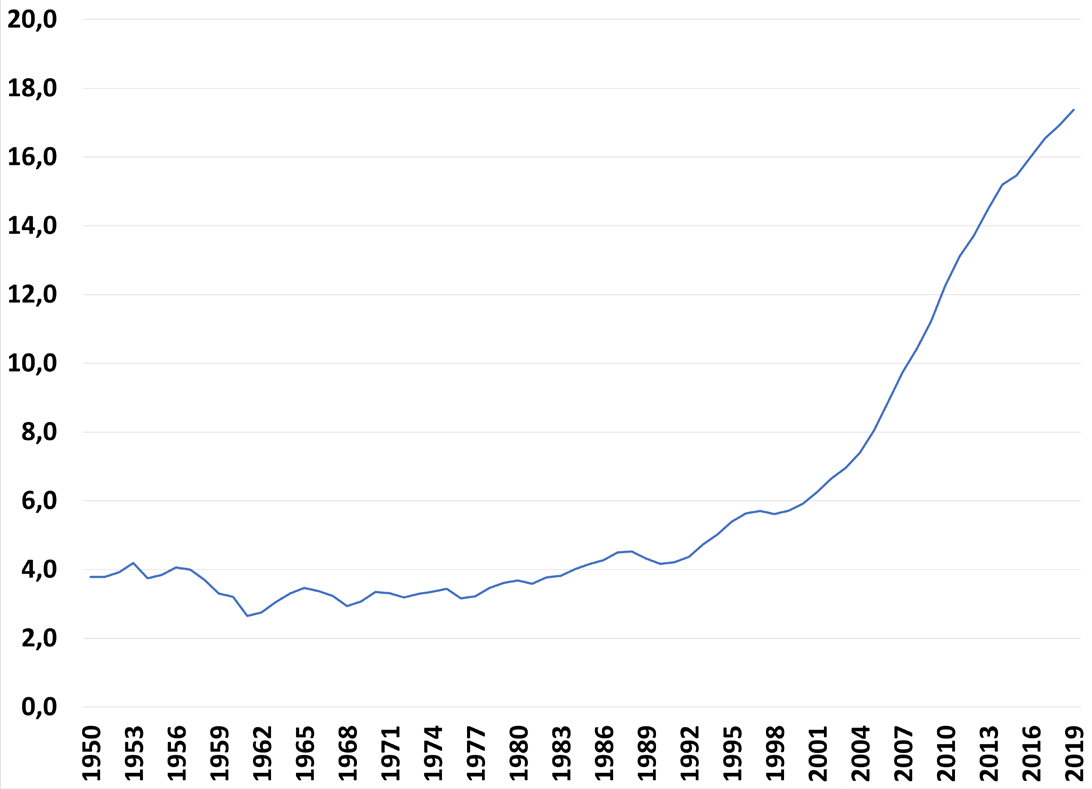
There is no other way to describe it: China is exceptional in the history of economic development over the last 250 years, surpassing even the earlier economic miracles of Asian economies like Japan or Korea. China’s share of global income has increased from less than 4% in 1968 to near 20% in 2021, with most of that increase occurring only after 2002. Indeed, the change in China’s share alone explains 87% of the entire decline in the share of the advanced economies in the period 1980–2015. India is nowhere compared to China (Figure 1).
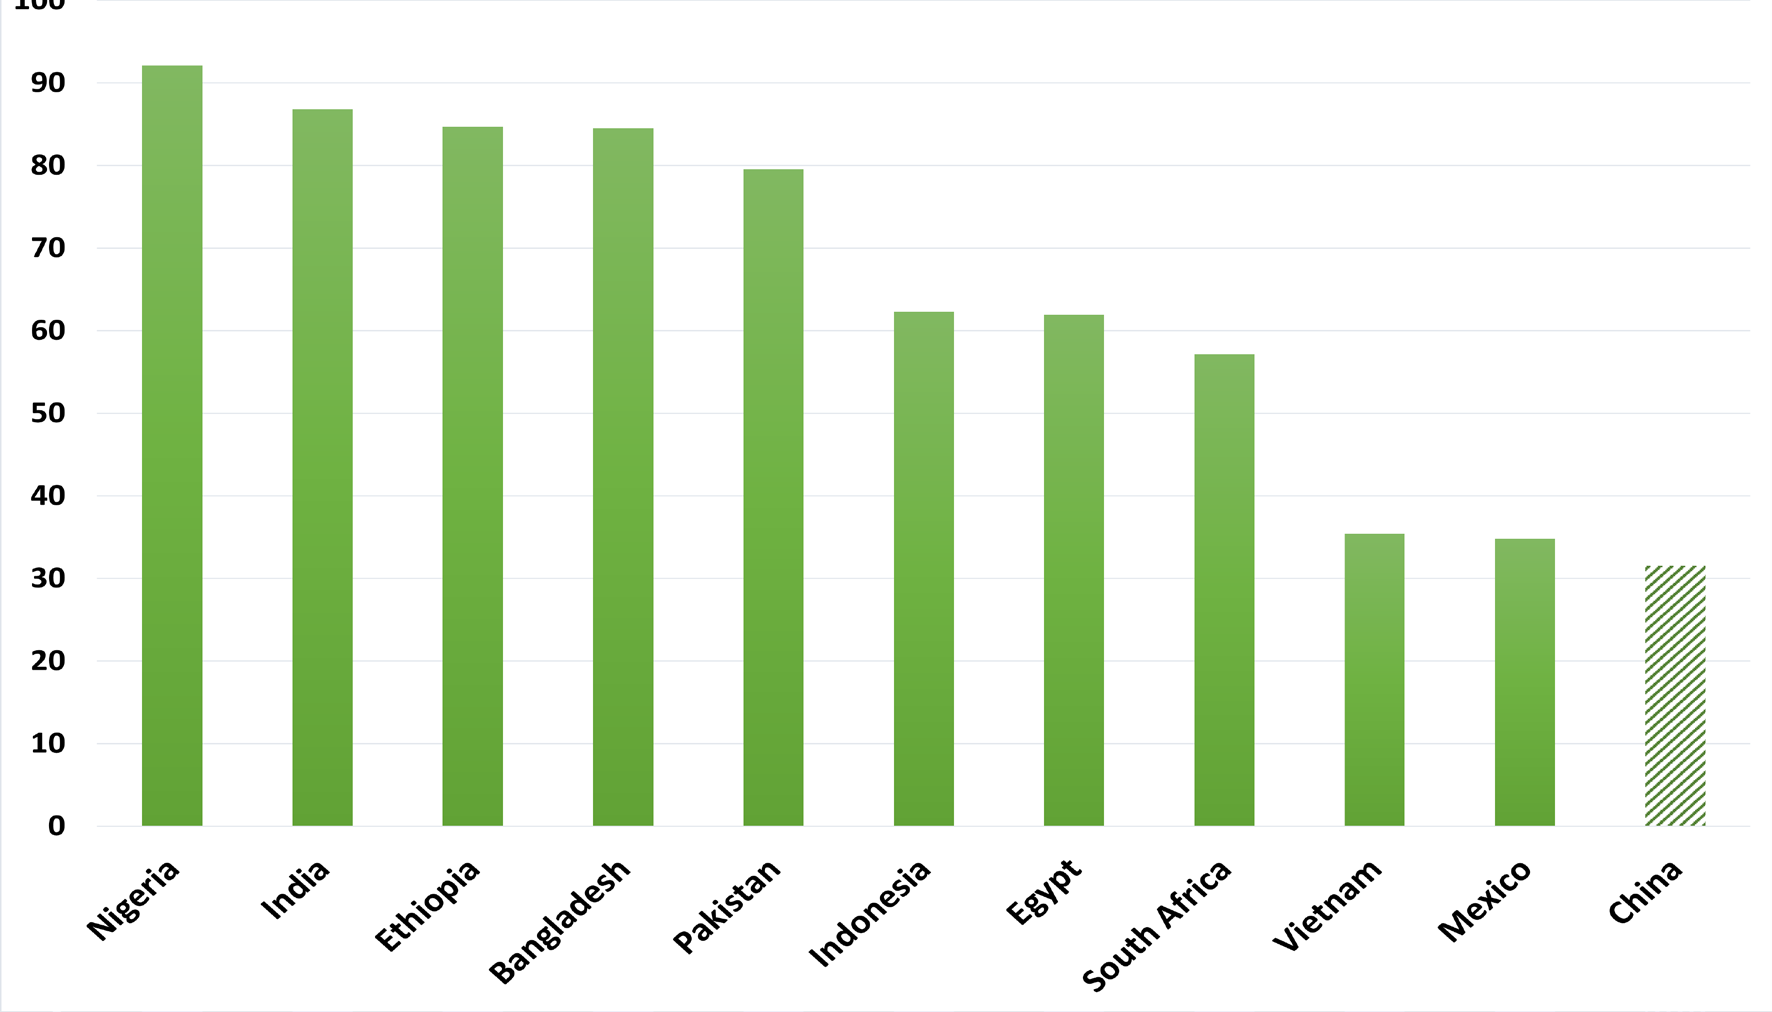
As a result of this exceptional growth in output and incomes, nearly 900 million Chinese have been taken out of poverty (or $1.90 a day as defined by the World Bank (2016The World Bank. (2016). Poverty. The World Bank. ons=CN)), while other huge “developing” economies have made little progress (Figure 2). Even if we use a more realistic threshold for poverty of $5.5 a day, China’s poverty rate is well below its peers.
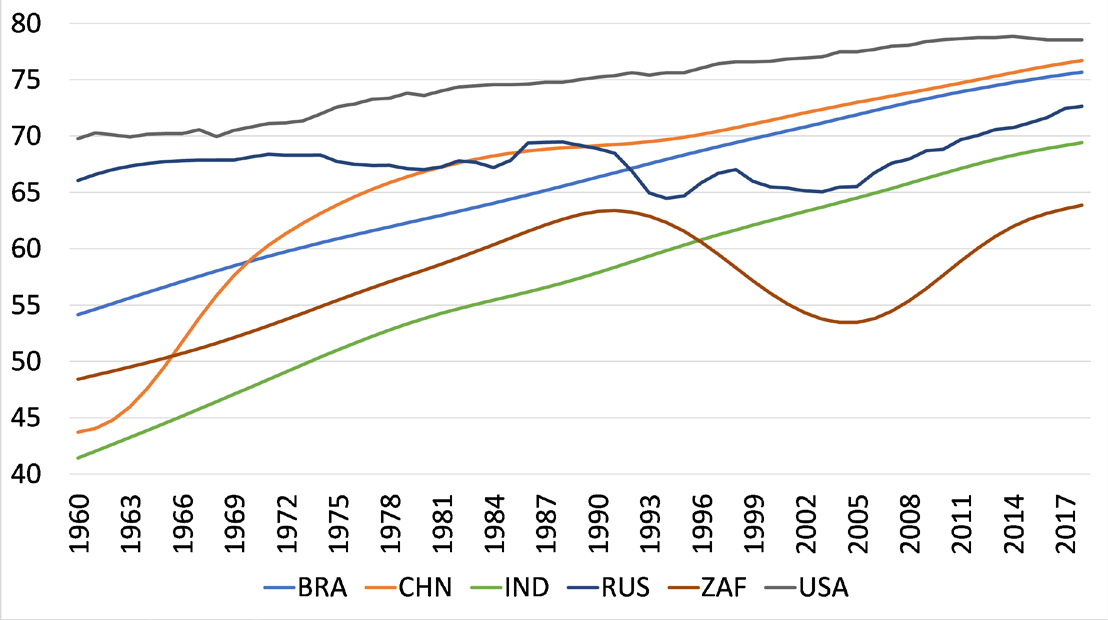
GDP is but one measure of progress. A key indicator of human development is life expectancy. From life expectancy at birth in 1960 of just 44 years, China’s average life expectancy is now 77 years. It is catching up with the US, where there has been a fall since the end of the Great Recession. And China has outstripped all the other so-called large emerging economies (Figure 3) (Roberts, 2020bRoberts, M. (2020a). China: Three models of development. Austrian Journal of Development Studies, 37(1), 10-39.).
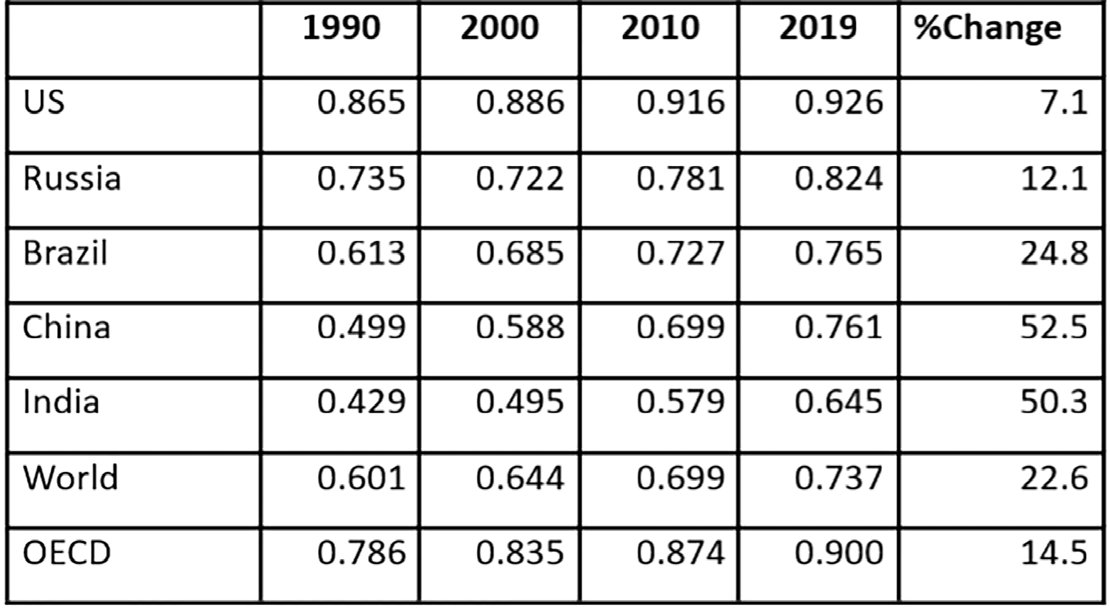
The World Bank has a Human Development Index (HDI) which “is a summary measure of average achievement in key dimensions of human development: a long and healthy life, being knowledgeable and having a decent standard of living” (UNDP, n.d.UNDP, United Nations Development Programme. (n.d.). Hu man Development Index (HDI). dex-hdi#:~:text=The%20Human%20Development%20 Index%20(HDI,a%20decent%20standard%20of%20li ving.&text=The%20standard%20of%20living%20dimen sion,gross%20national%20income%20per%20capita.) (Figure 4).1
China’s HDI was 17% below the world average in 1990 and less than two-thirds of the advanced economies (OECD). It reached the world average in 2010 and just prior to the start of the COVID-19 pandemic was 3% above - and 85% of the OECD average. India is still 13% below the world HDI average. China is now on a par with Brazil in human development, with a population over six times larger.
Models of Development
What explains this miracle? Several explanations that have been offered. This section looks at these explanations for China’s economic explosion.
The consensus view is based on the neoclassical model of growth. World Bank economist Lin (2012The World Bank. (2012). China 2030: Building a Modern, Harmonious, and Creative High-Income Society. Washin gton: World Bank Group.) argues that China’s miracle is down to a switch in economic policy under Deng Xiaoping in the late 1970s away from what he calls a “comparative advantage defying strategy” (CAD) towards a “comparative advantage following strategy” (CAF). By this, he means that China’s leaders realized that the bias in state intervention towards developing heavy industry at the expense of agriculture or increasing capital inputs instead of using the plentiful supplies of cheap labor created distortions in the prices of products, weakened agricultural prices and rural incomes relative to industry, kept consumption too low and generated over accumulation with low capital productivity. This led to a range of “unviable” industries that could not compete in world markets. But under Deng, China took advantage of its real comparative advantage, the plentiful labor factor of production. Economic growth then took off and China competed successfully in world markets through a powerful combination of foreign investment and cheap labor (Roberts, 2020aRoberts, M. (2020a). China: Three models of development. Austrian Journal of Development Studies, 37(1), 10-39.).
In this view, previously Mao had pursued a wrong strategy. Under Mao, lack of industrialization, especially large heavy industries that supported military strength, was seen as the root cause of China’s then backwardness. China under Mao gave firms monopoly power in heavy industry sectors and subsidized them with lower-priced inputs, often creating shortages. It allowed China to establish modern industries, test nuclear bombs in the 1960s and launch satellites in the 1970s. But labor-intensive sectors were repressed and yet that was where it held a comparative advantage. Thus, efficiency was low and growth prior to 1979 was driven mainly by increased inputs not productivity (Roberts, 2020aRoberts, M. (2020a). China: Three models of development. Austrian Journal of Development Studies, 37(1), 10-39.).
But under Deng, the argument goes, China embarked on a “dual-track system”, introducing reforms in some areas while maintaining the status-quo in others. Farmers were one of the first beneficiaries. They were allowed to own their land again (collective farms were broken up) and could set prices for selling their production that exceeded quota obligations sold to the state at fixed prices. Meanwhile, private enterprises, joint ventures and foreign investment into labor-intensive sectors were allowed (Roberts, 2020aRoberts, M. (2020a). China: Three models of development. Austrian Journal of Development Studies, 37(1), 10-39.).
Under Mao, developing capital-intensive heavy industries was extremely costly and such industries could not hope to be viable in an open, free market economy. Thus, the government had to distort the economic institutions and nationalize resources to sustain non-viable industry. The priority industries under this strategy were inconsistent with the comparative advantage determined by the factor endowments in those provinces. Mao’s “great leap-forward” strategy retarded the functions of market, impeded capital accumulation and hindered technology and productivity progress in the provinces. Therefore, it was imperative to replace the CAD strategy with a CAF strategy (Roberts, 2020aRoberts, M. (2020a). China: Three models of development. Austrian Journal of Development Studies, 37(1), 10-39.).
But is this neoclassical model a convincing explanation for the take-off of China from the 1980s onwards? China’s economic growth prior to the Deng “reforms” was not poor. China’s real GDP increased at an annual average of 6.7% from 1952-78, according to the World Bank, more than double that of the US during the same period. If we exclude the very first years of the People’s Republic from 1952 to 1962—i.e., between the completion of the unification of the continental territory and the period of the break with the Soviet Union— there was a recorded average of 8.2% growth up to 1978, despite the damaging impact of the Cultural Revolution (World Bank 2013aThe World Bank. (2013a), The world bank in middle income c ountries.). The momentum of the Chinese economy was already strong before Deng.2
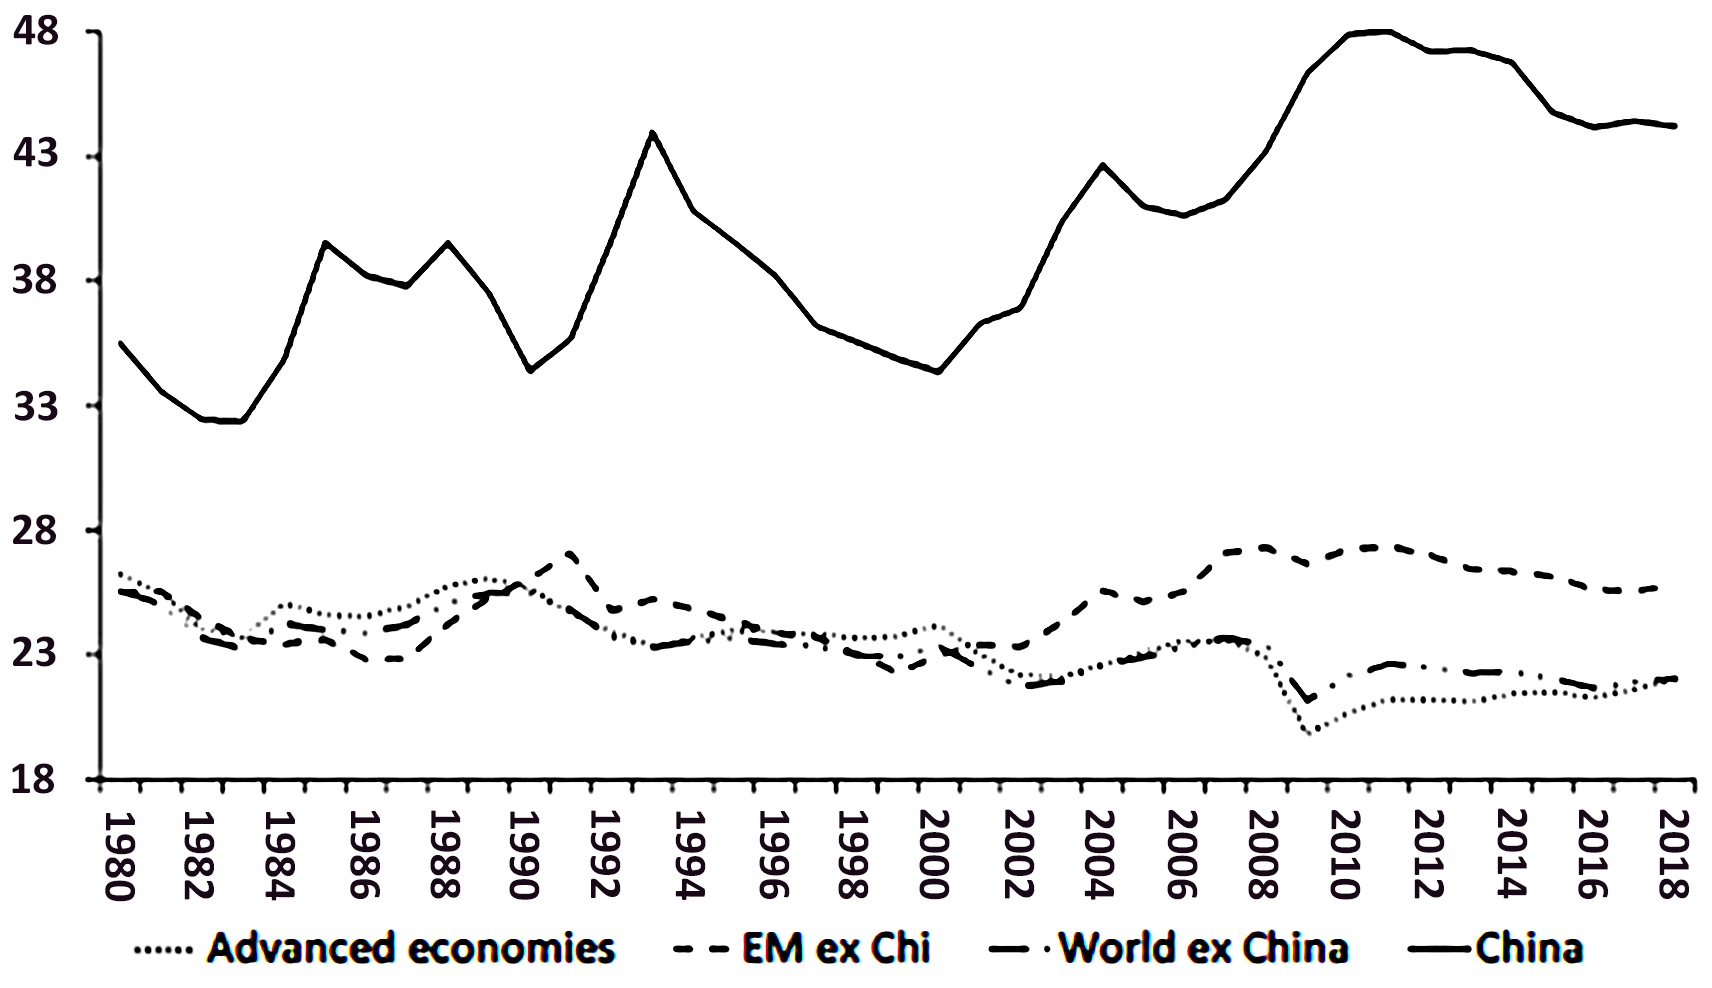
There is a Keynesian explanation as an alternative to the neoclassical market model. Here the key factor in China’s development was not a switch to a policy of “comparative advantage” under Deng towards using cheap labor that allowed China to “take off”. Instead, it was increased investment in machinery and technology i.e., greater capital inputs. Average growth rates of capital stock in China (excluding housing) rose 9.7% a year in 1952-78 and 10.9% in the post-Deng period (World Bank 2013aThe World Bank. (2013a), The world bank in middle income c ountries.). It is this sustained high accumulation (Figure 5), enabled by surplus transfers from rural areas, that explains the success of industrialization and, to a large extent, the robust rate of GDP growth.
The Deng revolution was not to adopt CAF, as Lin claims, but to end administrative control of investment and replace it with Keynesianstyle stimulus and management that would boost private sector investment. So, the Chinese model of development, or “socialism with Chinese characteristics”, is really a radical version of Keynesianism (Ross, 2013Ross, J. (2013) Key Trends in Globalisation. on/2013/09/china-has-overtaken-the-us.html). It is different to Keynesian policies in the US and Europe, where budget deficits are utilized, low central bank interest rates are pursued with some forms of quantitative easing to drive down long-term interest rates (Roberts, 2020aRoberts, M. (2020a). China: Three models of development. Austrian Journal of Development Studies, 37(1), 10-39.). In China, in contrast, relatively limited budget deficits have been combined with low interest rates, a state-owned banking system and a huge state investment programme. China pursued full blooded policies of the type recognizable from Keynes General Theory. It was Deng’s lack of ideology or commitment to either a market or state-led economic model (Deng: “I don‘t care if the cat is black or white, so long as it catches mice.”)3 that was the reason for China’s economic success after 1978.
A Marxist model of China’s economic development does not start from looking at the comparative advantage of factors of production and or at the rate of savings or investment in an economy. Marxist theory starts from the law of value. Marx’s law of value argues that, under capitalism, production is not to meet consumer needs but primarily to obtain profit. Value can only be created by the exertion of human labor. Surplus value (or profit) thus emerges when capitalist producers sell goods and services on a market for commodities for a price that is higher than the costs of production. That is possible because the value created by labor power is more than the value paid to labor power.4 The issue is how much the law of value and private ownership dominates in the Chinese economy over planning for social needs based on state ownership of the means of production.
The Soviet Union restricted the law of value to the barest minimum through central planning, state ownership of industry and collectivization of agriculture (Roberts, 2020aRoberts, M. (2020a). China: Three models of development. Austrian Journal of Development Studies, 37(1), 10-39.). The switch from a centrally planned economy in the Soviet Union after 1990 into a market economy with foreign investment and privatization, was carried out overnight with disastrous consequences. But as Isabelle Weber (2021Weber, I. (2021). How China escaped shock therapy: The mar ket reform debate. London: Routledge.) has shown, after much debate, China’s leaders after Mao did not go down the road of restoring capitalism through the “shock therapy” of privatization and the dismantling of state control. Instead, they eventually opted for an opening-up of the planned state-owned economy to capitalism, partly through privatization but mainly through foreign investment. This meant a gradual increase in the influence of the law of value into the Chinese economy; namely a bigger private sector, the accumulation of capital for profit, with prices determined by markets and not by a plan; and finally, the opening up of “free trade” and foreign investment.5
The State-Private Sector Balance
Over the last 40 years, there has been a significant expansion of privately-owned companies, both foreign and domestic, with the establishment of a stock market and other financial institutions (Roberts, 2020aRoberts, M. (2020a). China: Three models of development. Austrian Journal of Development Studies, 37(1), 10-39.). Indeed, most ob-servers, using official data, reckon that private sector enterprises constitute around 60-70% of GDP and assets now (Xinhua, 2018Xinhua. (2018).).
But this is misleading. Szamosszegi and Kyle (2011Szamosszegi, A., & Kyle, C. (2011). US-China Commission on State-owned enterprises and state capitalism. (2015). les/2015/06/US-China-Commission_State-Owned-En terprises-and-State-Capitalism.pdf) analyzed the influence of the state se-ctor in China. They defined the state sector as consisting of three main components: state-owned enterprises (SOEs) fully owned by the state through the State-owned Assets and Supervision and Administration Commission (SASAC); SOEs that are majority owners of en-terprises that are not officially considered SOEs but are effectively controlled by their SOE ow-ners; and entities owned and controlled indirectly through SOE subsidiaries based inside and outside of China (state-holding enterprises, SHEs). Urban collective enterprises and government-owned township and village en-terprises (TVEs) also belong to the state sector but are not considered SOEs.6 They concluded that: “When data are analyzed by sector, it be-comes clear that SOEs and SHEs account for the majority of investments in most major se-ctors in the Chinese economy (Szamosszegi & Kyle, 2011: 16Szamosszegi, A., & Kyle, C. (2011). US-China Commission on State-owned enterprises and state capitalism. (2015). les/2015/06/US-China-Commission_State-Owned-En terprises-and-State-Capitalism.pdf). “SOEs and SHEs were responsible for 40 percent of China’s GDP and 45 percent of non-agricultural GDP”( Szamosszegi & Kyle, 2011: 21Szamosszegi, A., & Kyle, C. (2011). US-China Commission on State-owned enterprises and state capitalism. (2015). les/2015/06/US-China-Commission_State-Owned-En terprises-and-State-Capitalism.pdf) and “it is reasonable to conclude that by 2009 nearly half of China’s economic output could be attributable to either SOEs, SHEs, and other types of enterprises controlled by the SOEs indirectly. If the output of urban collective enterprises and the government-run proportion of TVEs are considered, the broadly defined state sector likely approximates 50 percent.” (Szamosszegi & Kyle, 2011: 25Szamosszegi, A., & Kyle, C. (2011). US-China Commission on State-owned enterprises and state capitalism. (2015). les/2015/06/US-China-Commission_State-Owned-En terprises-and-State-Capitalism.pdf).
Similarly, Hsieh and Song (2015Hsieh, C. & Song, Z. (2015). Grasp the Large, Let Go of the Small: The Transformation of the State Sector in China (NBER Working Paper No. 21006).) found that “More than two-thirds of companies were directly or indirectly controlled by SASAC, but al-most half of these firms are legally registered as private” (p. 12). When these private companies are redesignated as state-controlled, then SOEs still make up a substantial part of the national economy – roughly controlling 30 percent of the total secondary and tertiary assets, or over 50 percent of total industrial assets (Hsieh & Song, 2015Hsieh, C. & Song, Z. (2015). Grasp the Large, Let Go of the Small: The Transformation of the State Sector in China (NBER Working Paper No. 21006).).
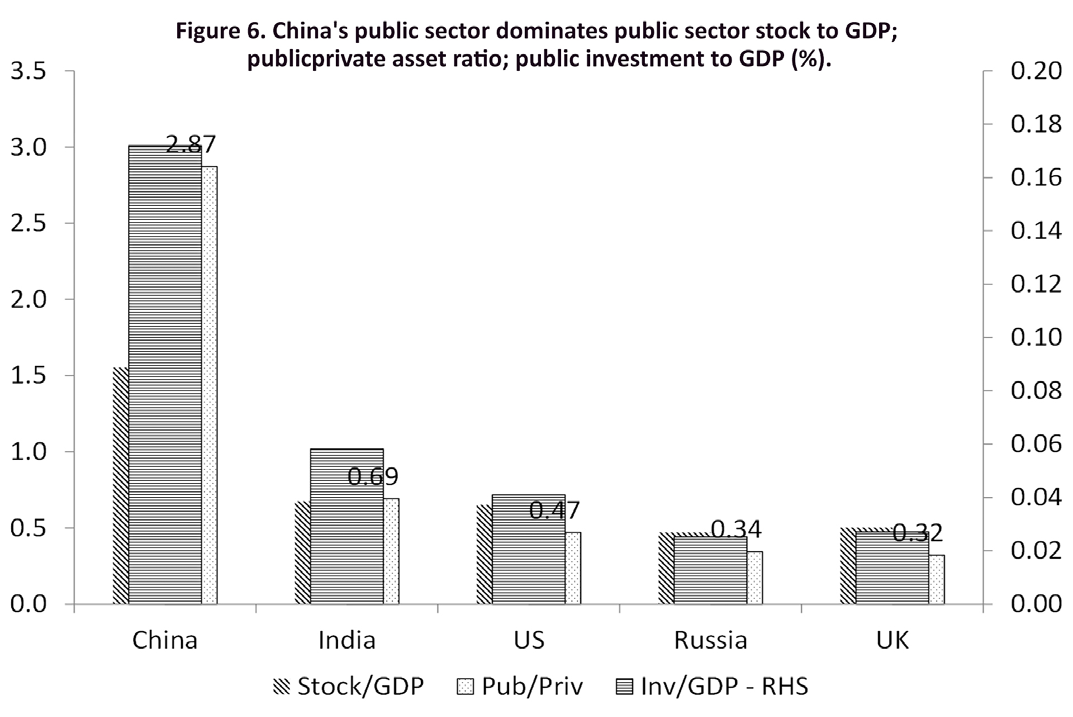
The size and influence of the state sector in China is not replicated in any other major economy (Figure 6). The IMF public sector database (IMF, 2017IMF. (2017). Estimating the stock of public capital in 170 countries. Investment and Capital Stock Dataset, 1960-2015.) shows that public sector stock to GDP stands at 150%; well ahead of that other Asian miracle of the past, Japan; and three times larger than in India or the US. Public sector assets are over three times larger than the private sector, while in every other major economy, private sector assets are larger. Public investment in China is annually 16% of GDP compared to less than 4% in the US or the UK. China is home to 109 corporations listed on the Fortune Global 500 - but only 15% of those are privately owned. The major banks are state-owned and their lending and deposit po-licies are directed by the government (much to the chagrin of China’s central bank and other pro-capitalist elements) (Roberts, 2020aRoberts, M. (2020a). China: Three models of development. Austrian Journal of Development Studies, 37(1), 10-39.).
At the same time, the single party state machine infiltrates all levels of industry and activity in China. Fan, Morck and Yeung (2013Fan, J., Morck, R., & Yeung, B. (2013). Translating Market So cialism with Chinese Characteristics into Sustained Pros perity. In Joseph P. H. Fan & Randall Morck (Eds.), Ca pitalizing China (pp. 1-32). Chicago: University of Chica go Press, NBER 2013.) found that the CCP, by controlling the career advancement of all senior personnel in all regulatory agencies, all SOEs, and virtually all major fi-nancial institutions of SOEs and senior Party positions in all but the smallest non-SOEs, re-tains sole possession of Lenin’s Commanding Heights. “The CCP Organization Department (CCP OD) manages all senior promotions th-roughout all major banks, regulators, government ministries and agencies, SOEs, and even many officially-designated non-SOE enterprises. The Party promotes people through banks, regulatory agencies, enterprises, governments, and Party organs, handling much of the national economy in one huge human resources ma-nagement chart.” (Fan, Morck & Yeung, 2013: 2Fan, J., Morck, R., & Yeung, B. (2013). Translating Market So cialism with Chinese Characteristics into Sustained Pros perity. In Joseph P. H. Fan & Randall Morck (Eds.), Ca pitalizing China (pp. 1-32). Chicago: University of Chica go Press, NBER 2013.). In listed companies, “each enterprise also has a Communist Party Committee, headed by a Communist Party Secretary. These advise the CEO on critical decisions and are kept informed by Party cells throughout the enterprise that also monitor the implementation of party policies. Indeed, the Party Secretary plays a leading role in major decisions and can overrule or bypass the CEO and board if necessary.” (Fan, Morck & Yeung, 2013:8Fan, J., Morck, R., & Yeung, B. (2013). Translating Market So cialism with Chinese Characteristics into Sustained Pros perity. In Joseph P. H. Fan & Randall Morck (Eds.), Ca pitalizing China (pp. 1-32). Chicago: University of Chica go Press, NBER 2013.). Fraser Howie (2011Howie, F., & Walter, C. (2011). Red capitalism: The fragile fi nancial foundation of China’s extraordinary rise. Singapo re: Wiley.) highlighted how os-tensibly private companies are really “state overseen enterprises”. “All Chinese corporates are effectively either state owned enterprises or state overseen enterprises,” World-View (Stratfor, 2018Stratfor. (2018). World View. ldview.stratfor.com/article/state-owned-enterprises-a re-hard-habit-china-doesnt-want-break) found that “80-90% of SOEs are concentrated in vital or high-profit industries such as finance, power, energy, te-lecommunications and defence manufacturing. And these enterprises -particularly the roughly 100 centrally administered SOEshave grown much bigger.” (par.4). Milhaupt and Zheng (2016Milhaupt, C., & Zheng, W. (2016). Why mixed-ownership re forms cannot fix China’s state sector.) found that 95 out of the top 100 Chinese private firms and eight out of the top ten internet firms had a founder or de facto controller who was currently or formerly a member of central or local political organizations such as People’s Congresses and People’s Political Consultative Conferences. Also, state-controlled industrial as-sociations actively supervise the operations of private firms in their respective industries and have retained much, if not all, of the power exercised by their state predecessors. Private firms are prodded or even forced to participate in state-led industrial restructuring efforts. The right of corporate ownership must yield to the state’s plans for restructuring an industry (Milhaupt & Zheng, 2015Milhaupt, C., & Zheng, W. (2015). Beyond ownership: State capitalism and the Chinese firm. Georgetown Law Jour nal.).
Similarly, when considering the control over foreign investment, leading Chinese economist Yongding (2014Yongding, Y. (2014). Don’t bet on a Chinese financial melt down, at least for now, China-US Focus 9 April. Retrieved f rom) put it: “China has to maintain its capital controls in the fo-reseeable future. If China were to lose control over its cross-border capital flows, it could lead to panic and so capital outflows would turn into an avalanche and eventually bring down the whole financial system.” (par.14). It was these very restrictions that enabled China to expand investment and technology, employ swathes of labor and generally avoid control of its destiny by multinational combines, up to now (Roberts, 2020aRoberts, M. (2020a). China: Three models of development. Austrian Journal of Development Studies, 37(1), 10-39.).
And as David Kotz (2020Qi, H., & Kotz, D. (2020). The impact of state-owned enterp rises on China’s economic growth. Review of Radical Poli tical Economics, 52, 96-114.) concluded: “Most of the current studies ignore the role of SOEs in stabilizing economic growth and promoting technical progress. We argue that SOEs are playing a pro-growth role in several ways. SOEs stabilize growth in economic downturns by carrying out massive investments. SOEs promote major technical innovations by investing in riskier areas of technical progress. Also, SOEs adopt a high-road approach to treating workers, which will be favorable to the transition toward a more sustainable economic model. Our empirical analysis indicates that SOEs in China have promoted long-run growth and offset the adverse effect of economic downturns.” (Qi & Kotz, 2020: 112Qi, H., & Kotz, D. (2020). The impact of state-owned enterp rises on China’s economic growth. Review of Radical Poli tical Economics, 52, 96-114.).
Productivity versus Profitability
The Keynesian analysis correctly looks at investment in the means of production as the key driver of China’s development. But it misses a key barometer of economic development, the productivity of labor. In so far as there is a private sector in a developing economy and world markets, then there is a continual conflict between increased productivity and profitability, as there is in capitalist economies where the law of value dominates.
The Marxist model argues that the level of productivity will decide economic growth because it reduces the cost of production and enables a developing nation to compete in world markets. But in a capitalist economy where the law of value and markets operate, there is a contradiction: a long-term inverse relationship between productivity and profitability (Roberts, 2018Roberts, M. (2018). Marx 200 – a review of Marx’s economics 200 years since his birth. Lulu.). In a capitalist economy, companies compete with each other to raise profitability through the introduction of new technologies. But as capitalists try to raise the productivity of labor by shedding labor with technology and so lowering labor costs and increasing profits and market share, the overall profitability of investment and production begins to fall. Then, in a series of crises, investment collapses and productivity stagnates (Roberts, 2020cRoberts, M. (2020a). China: Three models of development. Austrian Journal of Development Studies, 37(1), 10-39.).
So, in any analysis of China’s model of economic development, we must consider the impact of its large capitalist sector and its relative contribution to the economy – and that means looking at the rate of profit on capital invested both by the state and capitalist sectors.
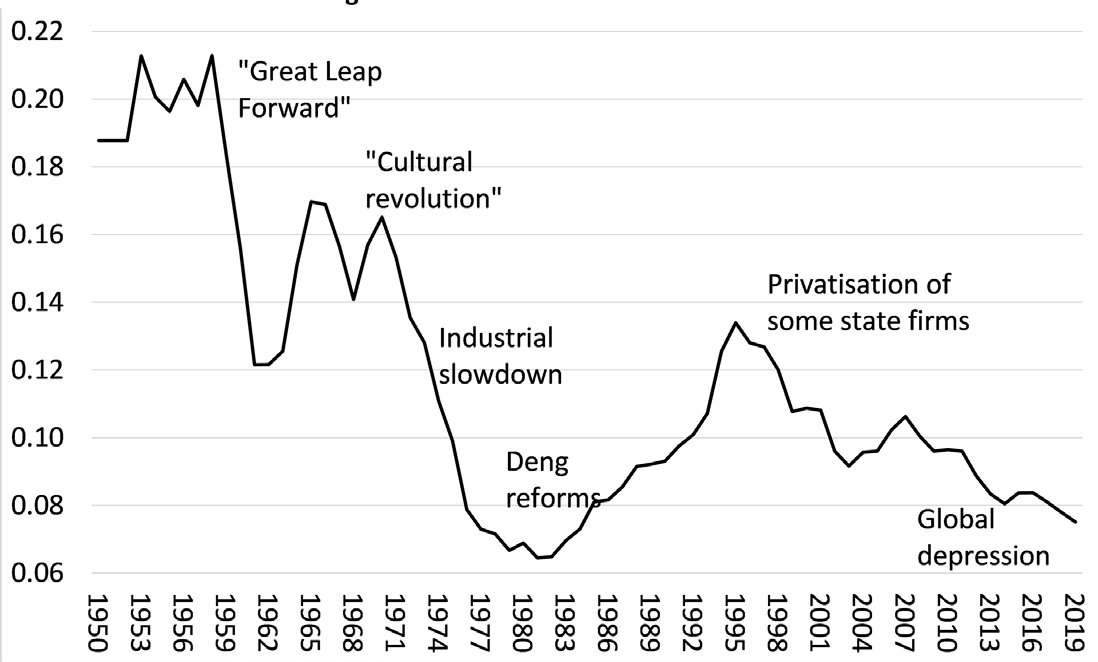
The empirical evidence reveals three phases of profitability in China (Figure 7). There was a general fall in profitability in the Mao period (when the capitalist sector was relatively small). Between 1978-95, there was an upswing in profitability as production expanded from the Deng reforms. But from the end of 1990s, there was a steady fall, as over-investment gathered pace and other economies, particularly in the developing world, went through a series of crises (Mexico 1994, Asia 1997-8, Latin America 1998-01). From about 2001 up to the Great Recession of 2008, there was a temporary rise in profitability as the world expanded at a credit-fueled pace and trade growth accelerated. However, since the Great Recession, the profitability of China’s burgeoning capitalist sector has been falling, along with investment and GDP growth.
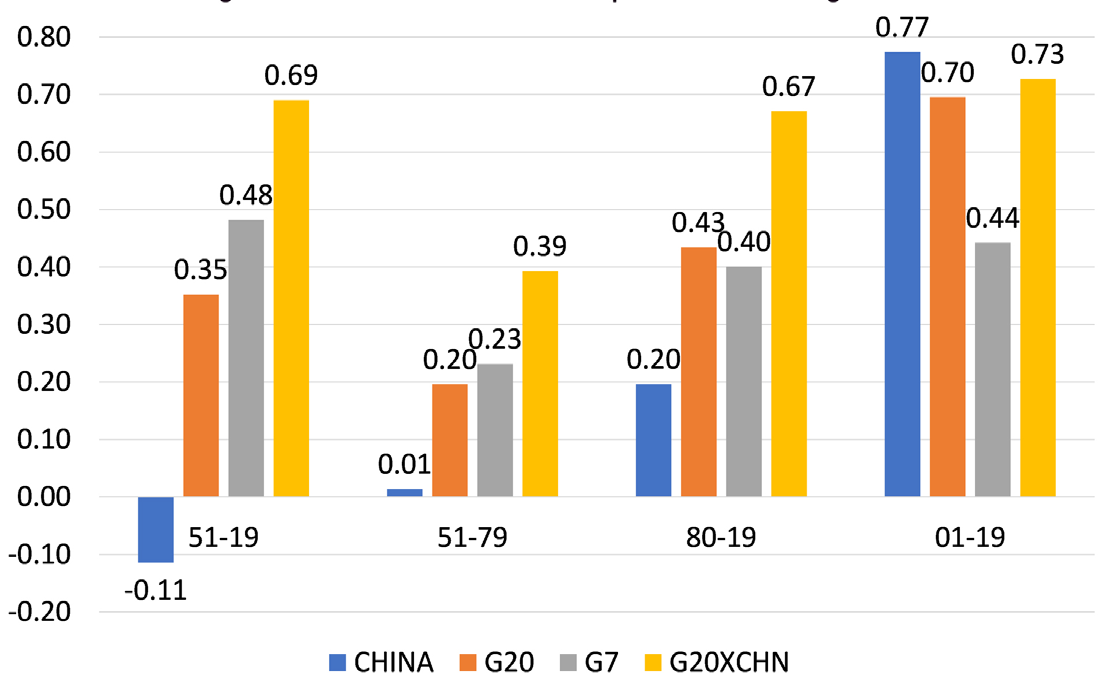
But the downward tendency of the rate of profit has not operated with the same effect in China as in the major capitalist economies. The state-dominated investment and capital stock in China means that there has been no strong correlation between the profitability of Chinese capital and real GDP growth since the formation of the People’ Republic until recently. In other words, the profitability of capital did not decide the level of investment in productive assets and economic growth (Roberts, 2021Carchedi, G., & Roberts, M. (2021). The economics of mo dern imperialism. Historical Materialism, 29(4), 23-69. Doi).
In the Mao period, there was no correlation between the rate of profit and real GDP growth. After Deng’s reforms in the 1980s, the correlation turned positive, although less positively correlated than in the rest of the G20 (capitalist) economies or the G7. However, since China entered the World Trade Organization and privatised sections of its state sector in the late 1990s and early 2000s, there has been a significant correlation between the profitability of Chinese capital and real GDP growth. So, the Chinese economy has become increasingly vulnerable to the vagaries of its capitalist sector and to international capital (Figure 8) (Roberts, 2021Carchedi, G., & Roberts, M. (2021). The economics of mo dern imperialism. Historical Materialism, 29(4), 23-69. Doi).
Does this mean that China is heading for major slump along classic capitalist lines some time in this decade? Brazilian Marxist economists, Marquetti et al (2020Marquetti, A., Ourique, L. E., & Morrone, H. (2020). A Classical-Marxian Growth Model of Catching Up and the Cases of China, Japan, and India: 1980–2014. Review of Radical Political Economics, 52(2), 312–334.) suggest that: “The larger profit rate explained the robust mechanization in the early stages of the process. But fast capital accumulation diminishes capital productivity and the profit rate. Then, the success in catching up must hinge on raising the saving and investment rates. It may further reduce capital productivity and the profit rate, putting the process at risk, which seems to be the case in China and India.” (p.330). The same warning is sounded by Marxist economist Minqi Li (2017Li, C. (2017, September 27). China’s 19th party congress. Bro okings. duct/chinas-19th-party-congress/): “if China were to follow essentially the same economic laws as in other capitalist countries (such as the United States and Japan), a decline in the profit rate would be followed by a deceleration of capital accumulation, culminating in a major economic crisis.” (Roberts, 2020cRoberts, M. (2020a). China: Three models of development. Austrian Journal of Development Studies, 37(1), 10-39.).
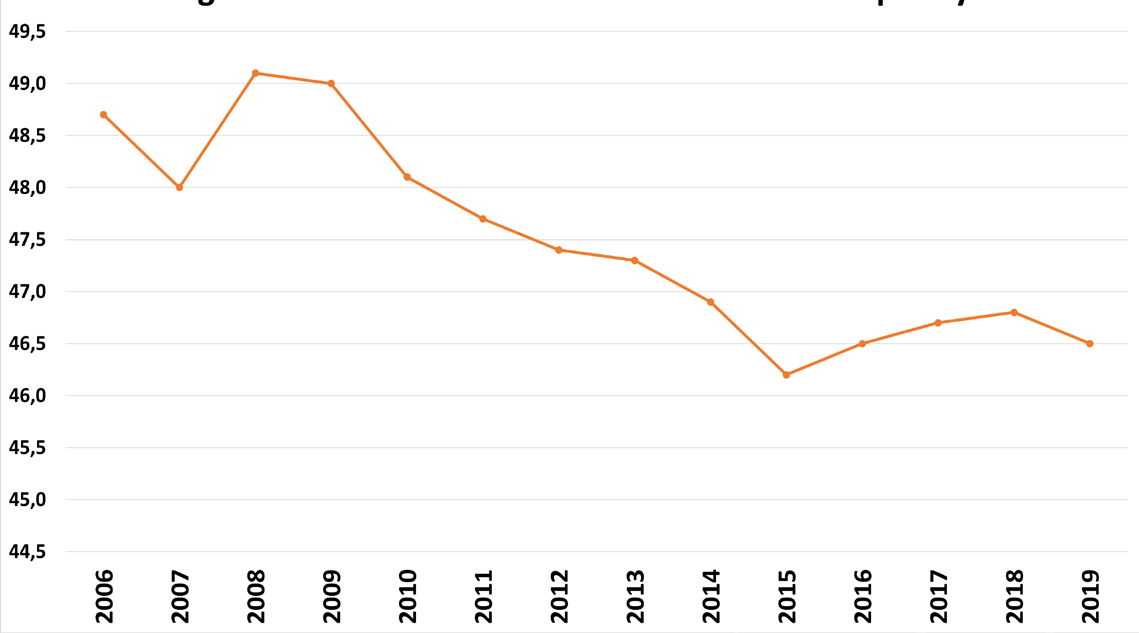
But does China follow “essentially the same laws as in other capitalist economies”? What has happened with the relative “liberalization” of the state-owned planned economy over the last 40 years is the encroachment of the law of value into new areas of the economy and with it, a huge rise in the inequality of wealth and income. China’s Gini income coefficient, an index of income inequality, according to Xie and Zhou (2014Xie, Y., & Zhou, X. (2014). Income inequality in today’s China (2014). Proceedings of the National Academy of Sciences of the United States of America (PNAS).), rose from 0.30 in 1978, when the Communist Party began to open the economy to market forces, to 0.49 by 2008. This rise in income inequality was partly the result of the urbanization of the economy as rural peasants moved to the cities. Urban wages in the sweatshops and factories are increasingly left peasant incomes behind (not that those urban wages are anything to write home about when workers assembling Apple iPads are paid under $2 an hour). But the rise in inequality was also partly the result of an elite controlling the levers of state power and allowing some Chinese (especially CPC members) to “get rich”. Urbanization has slowed since the Great Recession (from a peak annual rate of 3.75% before to just 1.3% after 2008) and China’s Gini inequality index has fallen back, if still at a high level by international comparison (Figure 9).
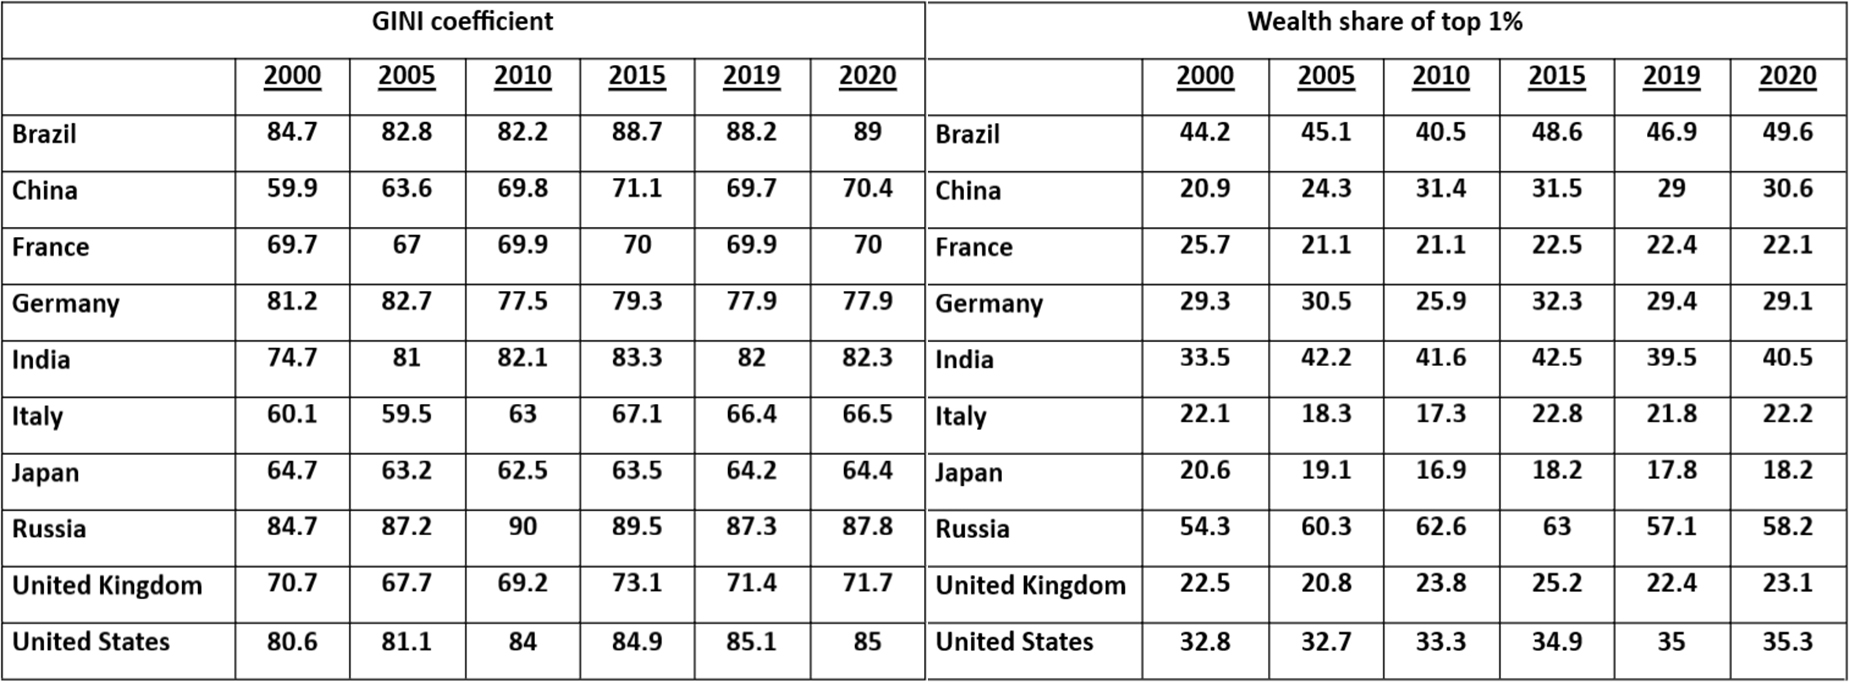
When it comes to inequality of personal wealth, China is not so unequal as many of its international peers (Credit Suisse, 2021Credit Suisse. (2021). The Global wealth report 2021. United States: Credit Suisse Research Institute.). The Gini inequality of wealth ratio is much higher in Brazil, Russia and India, and higher in the US and Germany. According to the latest estimates, the top 1% of wealth holders in China take 31% of all personal wealth compared to 58% in Russia, 50% in Brazil, 41% in India and 35% in the US. This is a good measure of the economic power of the top elite and oligarchs in these countries (Figure 10) (Roberts, 2021Carchedi, G., & Roberts, M. (2021). The economics of mo dern imperialism. Historical Materialism, 29(4), 23-69. Doi).
Much is made of the number of billionaires in “socialist” China, but given the size of the population and GDP, the per capita ratio compared to the US and other major economies is relatively low. And the inequality of wealth in China is centred on property, not financial assets (so far), unlike the main capitalist economies of the G7 (Roberts, 2021Carchedi, G., & Roberts, M. (2021). The economics of mo dern imperialism. Historical Materialism, 29(4), 23-69. Doi). While over 90% of housing is privately owned, only 30% of stocks and shares are. That is because of the dominance of SOEs in corporate equity.
The Growth Challenge
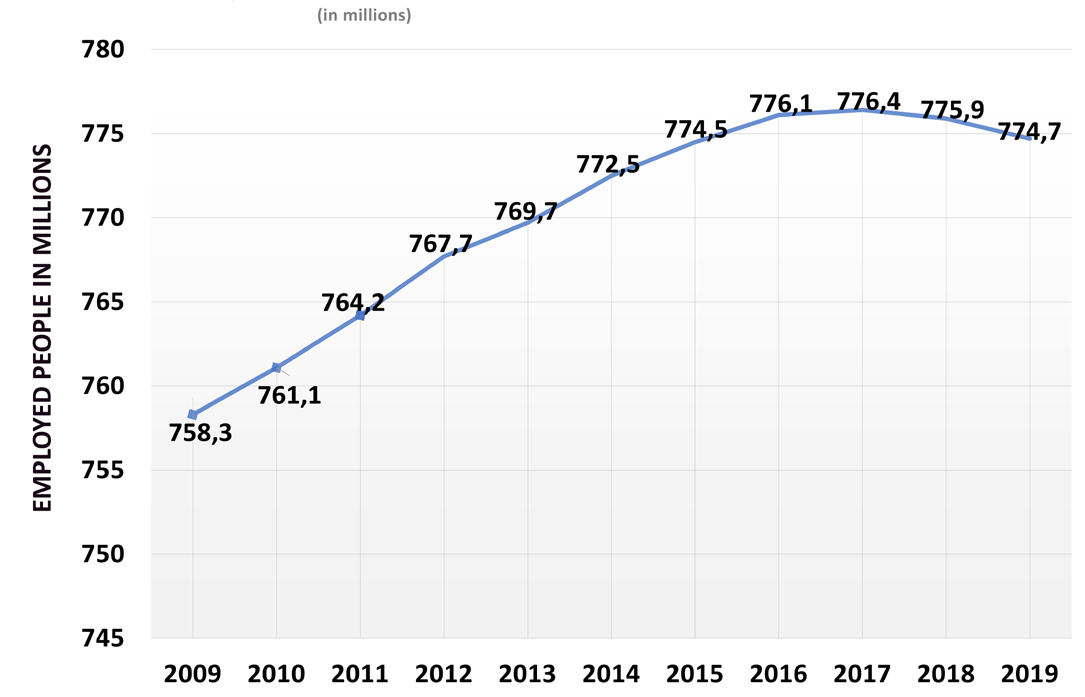
Almost half of China’s GDP growth since 1978 was from “capital deepening” (i.e. investment), about one-third was from increased labor productivity and the rest was from an expanding labor force (World Bank, 2019The World Bank. (2019). Innovative China: New Drivers of Growth World Bank Group Development Research Cen ter of the State Council, the People’s Republic of China. Washington: World Bank Group.). China’s labor force is no longer expanding – indeed the opposite is the case (Figure 11). China’s population peaked in 2021 and the working age population is set to fall 20% by 2050, the aim of investment must be towards job creation, automation and productivity growth (Roberts, 2020cRoberts, M. (2020a). China: Three models of development. Austrian Journal of Development Studies, 37(1), 10-39.). The latest census showed its population at 1.41bn up just 5.4% from 1.34bn in 2010 — the lowest rate of increase between censuses ever. Those over-65s now make up 13.5% of the population, compared with 8.9% in 2010 when the last census was completed (Roberts, 2021Carchedi, G., & Roberts, M. (2021). The economics of mo dern imperialism. Historical Materialism, 29(4), 23-69. Doi).
Thus, any idea that China can grow through the use of cheap labor (if it ever did, as explained above) is over. Real GDP growth now depends on capital investment and particularly hi-tech investment aimed at raising the average level of labor productivity. China’s average productivity level is currently just 20% of the US (Figure 12).
What are the prospects for China’s economic growth from hereon and will it continue to close the gap with the US? A program launched in 2015, Made in China 2025, aims to make the country competitive within a decade in ten industries, including aircraft, new energy vehicles, and biotechnology (Roberts, 2017Roberts, M. (2017, October 25). Xi takes full control of Chi na’s future. dpress.com/2017/10/25/xi-takes-full-control-of-chi nas-future/). According to a report by US investment bank, Goldman Sachs, China’s digital economy is already large, accounting for almost 40% of GDP and fast growing, contributing more than 60% of GDP growth in recent years (Roberts, 2021Carchedi, G., & Roberts, M. (2021). The economics of mo dern imperialism. Historical Materialism, 29(4), 23-69. Doi). “And there is ample room for China to further digitalize its traditional sectors.” (Goldman Sachs, 2022Goldman Sachs. (2022). China. Goldman Sachs Insights. Ret rieved from pics/china.html).
But there is a long way to go. The US economy remains highly productive even compared to other advanced economies. The US remains the global R&D leader, accounting for nearly 30% of the world total. Data on patents granted—either total or specifically abroad—show that the US share has held roughly steady at around 20%. China’s share of total patents granted has risen very rapidly over the last decade to over 20%, but most patents granted to Chinese innovators have come from the domestic patent office, with far fewer granted abroad (Statista, 2021Statista. (2021, August 13). Intellectual property worldwide -Statistics & Facts. Statista.).
Knowledge and technology intensive (KTI) industries contribute 38% of US GDP, the highest of any major economy. But China is not far behind at 35%, extremely high for a developing economy. While the US is the largest producer of high-tech goods, its share of world exports has shrunk considerably while China’s share has grown. China’s R&D intensity, measured by R&D spending as a percentage of GDP, was 2.1 % of GDP versus 2.8% for the US. Indeed, China has seen an almost 160% increase in ‘intellectual property’ receipts from the world in the past decade, compared with an 11% increase for the US, which indicates China’s increased knowledge diffusion throughout the world (Santacreu & Mackenzie, 2019Santacreu & Mackenzie (2019). The source article does not provide a separate full bibliographic entry for this citation.).
China’s information technologies (IT) share of GDP climbed from 2.1% in 2011Q1 to 3.8% in 2021Q1. Although China still lags the US, Europe, Japan and South Korea in its IT share of GDP, the gap has been narrowing over time (Roberts, 2021Carchedi, G., & Roberts, M. (2021). The economics of mo dern imperialism. Historical Materialism, 29(4), 23-69. Doi). The global innovation index (WIPO, 2019World Intellectual Property Organisation (WIPO). (2019). Glo-) shows that China’s innovation capacity has been improving steadily. China is moving up in cross-country rankings from 29 in 2011 to 17 in 2018 and is now the highestranking middle-income country and the first middle-income country to join the 20 most innovative (WIPO, 2019World Intellectual Property Organisation (WIPO). (2019). Glo-). China has also redoubled efforts to build its own semiconductor industry. The country buys about 59% of the chips sold around the world. To rectify this, Made in China 2025 earmarks $150 billion in spending over ten years.
Then there is China’s Belt and Road Initiative7 (BRI), a global development strategy involving infrastructure development and investments in 152 countries and international organizations. Contrary to views of Western economists, the BRI is not aimed primarily to make profits. It is to expand China’s economic influence globally and extract natural and other technological resources for the domestic economy. And the BRI is not, as some Marxist economists in the West argue (Harvey, 2016Harvey, D. (2016). Abstract from the concrete. Bucharest: Sternberg Press.), the product of the need to absorb “surplus capital” at home, similar to the export of capital by the capitalist economies before 1914 that Lenin presented as key feature of imperialism. China is not investing abroad through its state companies and banks because of “excess capital” or even because the rate of profit in state and capitalist enterprises has been falling (Roberts, 2017Roberts, M. (2017, October 25). Xi takes full control of Chi na’s future. dpress.com/2017/10/25/xi-takes-full-control-of-chi nas-future/). Indeed, China looks to expand its technological prowess and its influence globally through the Initiative to the likes of African and other states. And it is able to do so because its economic model does not rest on the falling profitability of its admittedly sizeable capitalist sector. An Institute of International Finance (IIF) report found that China is now the world’s largest creditor to low-income countries.
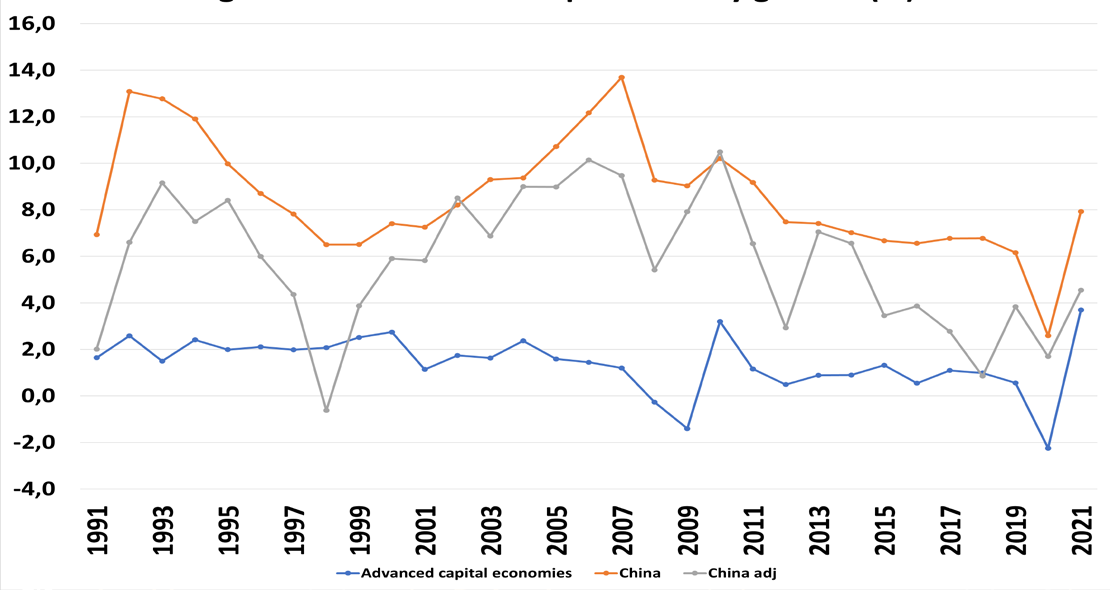
Even if you accept the downward adjustments made by the Conference Board to China’s official productivity record (Wu, 2014Wu, H. (2014). China’s Growth and Productivity Performance Debate Revisited - Accounting for China’s Sources of Growth with a New Data Set. New York: The Conference Board.), China still achieved an over 4% a year productivity growth in the last decade, some four times faster than in the advanced capitalist economies (Figure 13) (Roberts, 2021Carchedi, G., & Roberts, M. (2021). The economics of mo dern imperialism. Historical Materialism, 29(4), 23-69. Doi).
So even if the labor force does not grow in this decade (or even declines by say 0.5% a year), real GDP growth in China is still going to be at a minimum of 3.5% a year, and much more likely to be 5-6% a year, close to the Chinese government’s forecast in its latest five-year plan (Roberts, 2021Carchedi, G., & Roberts, M. (2021). The economics of mo dern imperialism. Historical Materialism, 29(4), 23-69. Doi). Arthur Kroeber, head of research at Gavekal Dragonomics, has put it (Kroeber, 2021Kroeber, A. (2021, May 20). Don’t bet against China’s investment-led growth model. Financial Times. Ret rieved from 6e-4af8-a703-1c92066065c7): “Is China fading? In a word, no. China’s economy is in good shape, and policymakers are exploiting this strength to tackle structural issues such as financial leverage, internet regulation and their desire to make technology the main driver of investment.” Kroeber concludes that: “on a two-year average basis, China is growing at about 5 per cent, while the US is well under 1 per cent. By the end of 2021 the US should be back around its pre-pandemic trend of 2.5 per cent annual growth. Over the next several years, China will probably keep growing at nearly twice the US rate.”
Debt and COVID-19
Much is made of China’s rising debt levels as an obstacle to further growth and even leading to a financial crash. Mainstream economists have been forecasting for decades that China is heading for a debt crash of mega proportions. It’s true that according to the IIF, China’s total debt reached 317% of GDP (Lee, 2021Lee, A. (2021, June 5). China debt: has it changed in 2021 and how big is it now? South China Morning Post. Retrie ved from nomy/article/3135883/china-debt-has-it-changed-2021-and-how-big-it-now). But most of the domestic debt is owed by one state entity to another; from local government to state banks, from state banks to central government. When that is all netted off, the debt owed by households (54% of GDP) and corporations is not so high, while central government debt is low by global standards. Moreover, external dollar debt to GDP is very low (15%) and indeed the rest of the world owes China way more: 6% of global debt. China is a huge creditor to the world and has massive dollar and euro reserves, 50% larger than its dollar debt. A financial crisis is ruled out as long as the state controls the banking system, but there are dangers because of the recent attempts to loosen it up for private and foreign institutions to enter the arena (e.g. there are a growing number of bankruptcies in speculative financial entities) (Roberts, 2021Carchedi, G., & Roberts, M. (2021). The economics of mo dern imperialism. Historical Materialism, 29(4), 23-69. Doi).
Chinese leaders want to curb the debt level. Controlling the debt level can come in two ways; through higher growth from productive sector investment to keep the debt ratio under control and/or by reducing credit binges in unproductive areas like speculative property. The debt problem has been caused by the Chinese authorities having leant ever more towards expansion through the capitalist sector and particularly into unproductive sectors like property and finance at the expense of productive sectors like manufacturing technology, residential housing, public education and health (Roberts, 2021Carchedi, G., & Roberts, M. (2021). The economics of mo dern imperialism. Historical Materialism, 29(4), 23-69. Doi). The real estate sector now accounts for 13% of the economy from just 5% in 1995 and for about 28% of the nation’s total lending (Zhou, 2021Zhou, C. (2021, January 12). China GDP: how will economic growth be hit by Beijing’s new caps on real estate lending? South China Morning Post.).
President Xi Jinping said, “Houses are built to be inhabited, not for speculation.” But the government allowed capitalist speculation in property so that 15% of all apartments currently are owned as investments, often not even connected to electricity supply. This property speculation was fueled by credit funded by the state banks but also by “shadow banking” entities. This sort of speculation wasted resources and did not direct investment into areas like reducing CO2 emissions to meet the government’s declared aim to make China a “clean economy” (Roberts, 2020cRoberts, M. (2020a). China: Three models of development. Austrian Journal of Development Studies, 37(1), 10-39.).
A December 2020 meeting of the CPC Politburo vowed to end what it called a “disorderly expansion of capital”. The capitalist sector had got too big for its boots. For instance, the capitalist Ant Group was even aiming to take over household lending from the state banks. Ant and other Chinese capitalist tech and media companies were increasingly engaged in typically “Western”-type mergers, secret contracts and other financial irregularities. China’s regulators had been turning a blind eye to all this for years. Moreover, the financial faction in China’s leadership had got agreement to allow foreign investment banks to set up majority-owned companies in China for the first time, with the eventual aim of “freeing up” the finance sector from state control and allowing unregulated cross-border capital flows. In other words, China was set to become a full member of international finance capital. The authorities were also allowing uncontrolled cryptocurrency mining and operations in the country (Roberts, 2021Carchedi, G., & Roberts, M. (2021). The economics of mo dern imperialism. Historical Materialism, 29(4), 23-69. Doi).
But the COVID-19 pandemic changed all this. There was growing public anger at how the rich in China, as in the rest of the major economies, have gained hugely from the financial and property price boom during the pandemic, while the majority struggled through the lockdowns and faced increased costs in education, health and housing and a serious risk to decent jobs for graduates and others (Roberts, 2021Carchedi, G., & Roberts, M. (2021). The economics of mo dern imperialism. Historical Materialism, 29(4), 23-69. Doi).
The contradictions of China’s state-controlled economy alongside a large and growing capitalist sector intensified during the COVID-19 pandemic. If this were allowed to continue, it would begin to open up schisms in the CP and the party’s support among the population. Xi wants to avoid another Tiananmen Square protest in 1989 after a huge rise in inequality and inflation under Deng’s ‘social market’ reforms8 (Roberts, 2021Carchedi, G., & Roberts, M. (2021). The economics of mo dern imperialism. Historical Materialism, 29(4), 23-69. Doi).
Education, health and housing are the “three mountains” that all Chinese households aim to climb to get a better life – and yet costs for these were spiraling while the rich made millions. The Chinese leadership has been forced to zigzag back from “disorderly expansion” and respond to the public backlash by launching a programme for “common prosperity” (Yao, 2021Yao, K. (2021, September 2). What is China's 'common pros perity' drive and why does it matter? Reuters. hinas-common-prosperity-drive-why-does-it-mat ter-2021-09-02/) and through a crackdown on the consumer tech and media giants and by introducing curbs on private education and speculative property development (Roberts, 2021Carchedi, G., & Roberts, M. (2021). The economics of mo dern imperialism. Historical Materialism, 29(4), 23-69. Doi). It has also banned cryptocurrency operations (Sigalos, 2021Sigalos, M. (2021, July 7). China’s war on bitcoin just hit a new level with its latest crypto crackdown. CNBC. Ret rieved from na-cracks-down-on-crypto-related-services-in-ongo ing-war-on-bitcoin.html).
Xi’s crackdown on the billionaires and his call for reduced inequality is yet another zig in the zigzag policy direction of the Chinese bureaucratic elite: from the early years of rigid state planning to Deng’s “market” reforms in the 1980s; to the privatization of some state companies in 1990s; to the return to firmer state control of the “commanding heights” of the economy after the global slump in 2009; then the loosening of speculative credit after that; and now a new crackdown on the capitalist sector to achieve “common prosperity”. These zigzags are wasteful and inefficient. They happen because China’s leadership is not accountable to its working people; there are no organs of worker democracy. There is no democratic planning; only the 100 million CPC members have a say in China’s economic future, and that is really only among the top (Yang, Novokmet, & Milanovic, 2019Yang, L., Novokmet, F., & Milanovic, B. (2019). From workers to capitalists in less than two generations: A study of Chi nese urban elite transformation between 1988 and 2013. World Inequality Lab.). The other reason for the zigzags is that China is surrounded by imperialism and its allies both economically and militarily. Capitalism remains the dominant mode of production outside China, if not inside. ‘Common prosperity’ cannot be achieved properly while the forces of capital remain inside and outside China (Roberts, 2021Carchedi, G., & Roberts, M. (2021). The economics of mo dern imperialism. Historical Materialism, 29(4), 23-69. Doi).
But there is no reason for China to abandon its growth model based on state-led investment in technology to compensate for the decline its workforce. The move to investment in technology rather than heavy industry and infrastructure is key to China’s sustainable growth rate and to reducing the rise in greenhouse gas emissions, where China is now the world leader (Roberts, 2021Carchedi, G., & Roberts, M. (2021). The economics of mo dern imperialism. Historical Materialism, 29(4), 23-69. Doi). Some Western radical and Marxist economists advocate a switch from investment to consumption to expand the economy and reduce inequality (Pettis, 2021Pettis, M. (2021, October 15). Will China’s common prospe rity upgrade dual circulation? Carnegie. Retrieved from ht tps://carnegieendowment.org/chinafinancialmar kets/85571). But this semi-Keynesian solution has no validity. China’s stupendous growth up to now has not been achieved by getting consumption demand to boost the economy. That is the solution applied in Western capitalist economies and all that has achieved growth rates of just around 2% a year.
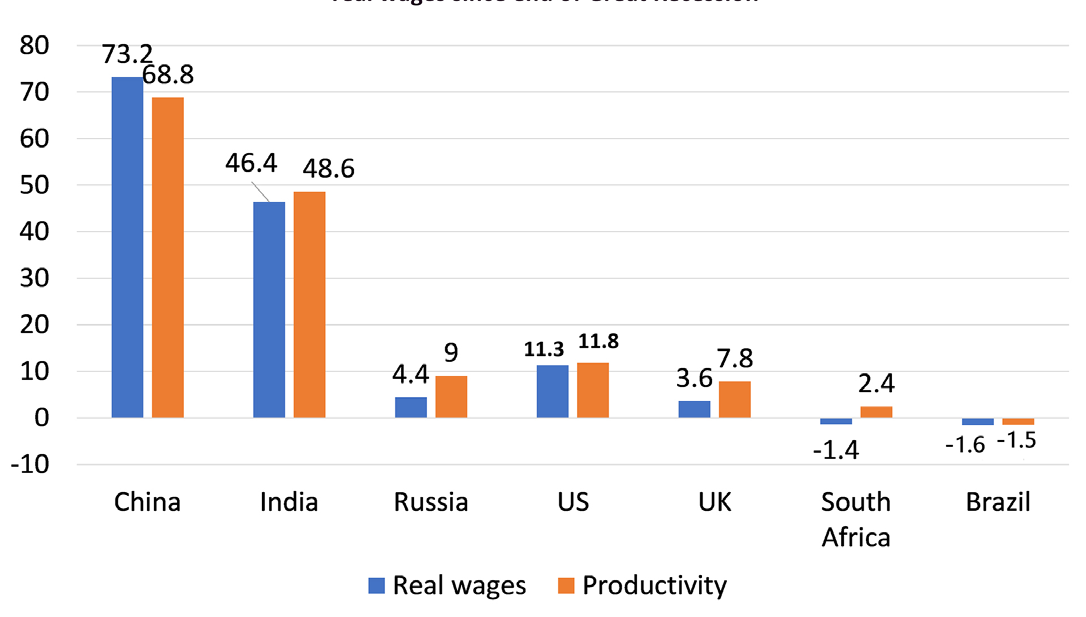
Anyway, it is not true that the Chinese model has restricted consumption. Consumption may have been relatively low internationally as a share of GDP, but that is due to the fast pace of investment expansion and urbanization in the last 40 years. Even so, real consumption growth has been 8.8% annually for over two decades — the highest of any major economy. Strong investment and increased productivity have enabled average real wages in the last decade to rise faster than other major economy and even faster than productivity (Figure 14).
Indeed, consumption is rising much faster in China than in the G7 because investment is higher. One follows the other; it is not a zero-sum game. And not all consumption has to be ‘personal’; more important is ‘social consumption’ i.e. public services like health, education, transport, communications housing; not just motor cars and gadgets. Increased personal consumption of basic social services is what is necessary. And it is here that China needs to act (Roberts, 2021Carchedi, G., & Roberts, M. (2021). The economics of mo dern imperialism. Historical Materialism, 29(4), 23-69. Doi).
China versus the US
Part of the growth challenge for China over the next few decades is the intensifying trade and technology ‘cold war’ with the US and its allies that threatens to become a hot one. This is the geopolitical issue of the 21st century. The US leaders have made that clear, as Commerce Secretary Wilbur Ross under Trump put it: the Made in China plan was an “attack” on “American genius.” (Woodward, 2018Woodward (2018). The source article does not provide a separate full bibliographic entry for this citation.).
Originally from President Nixon onward, the US aimed to “engage” with China and swamp the economy with its multi-nationals. But China has not played ball; indeed, its SOEs have become serious rivals to America’s conglomerates. So, the US has switched to a policy of “containment”. The aim now is to weaken China’s economy and destroy its influence and perhaps achieve “regime change”. Blocking trade with tariffs; blocking technology access for China and their exports; applying sanctions on Chinese companies; and turning debtors against China; this may all be costly to imperialist economies. But the cost may be worth it if China can be broken and US hegemony secured (Roberts, 2021Carchedi, G., & Roberts, M. (2021). The economics of mo dern imperialism. Historical Materialism, 29(4), 23-69. Doi).
The Transition to Socialism
The debate within the CPC leadership continues about which way to take China: towards a full market economy open to the winds of global capitalism or to stay as they are. But the current CPC leaders under Xi plan no change in the general philosophy of “socialism with Chinese characteristics” and thus the maintenance of the dominance of the state sector. Also, there is no intention of moving towards “democracy” or control of even local legal systems and decisions by the people. On the contrary, the leadership has set up even more repressive state security services to curb any dissidence, either from capitalists or the general population.
So how can we characterize China in 2022? China is not a capitalist economy, let alone an imperialist one (Carchedi & Roberts, 2021Carchedi, G., & Roberts, M. (2021). The economics of mo dern imperialism. Historical Materialism, 29(4), 23-69. Doi). In Marxist terminology, it is a “transitional economy”, namely one in between capitalism and socialism, but presumably heading towards socialism. That transition involves the loss of state power by capital and its “armed bodies of men” (Marx, 1875). The transitional economy has common ownership of the bulk of the means of production and credit and the planning of investment and production rather being than left to market forces. The aim is to raise the level of technology and productivity of labor in order to reduce working hours and gradually end scarcity in social needs. There should be a gradual replacement of commodity production with direct production for use; the gradual ending of wage labor and money, both as a means of exchange and as a store of value; and what Marx and Engels called the progressive “withering away” of state power (armies, police, officialdom).
On these criteria, China is clearly not socialist. China is a transitional economy as capitalist state power has been abolished and capitalist production reduced, but China does not meet the other criteria to make a transition to socialism: in particular, there is no equalization or restrictions on incomes and personal wealth; and the large capitalist sector is not steadily diminishing, on the contrary. But on the other hand, capitalists do not control the state machine, the Communist party officials do; the law of value (profit) and markets do not dominate investment, the large state sector does; and that sector (and the capitalist sector) are under an obligation to meet national planning targets (at the expense of profitability, if necessary) (Roberts, 2021Carchedi, G., & Roberts, M. (2021). The economics of mo dern imperialism. Historical Materialism, 29(4), 23-69. Doi).
China is at a crossroads in its development. Its capitalist sector has deepening problems with profitability and debt. The current leadership has pledged to continue with its state-directed economic model and broaden out its focus on economic growth to include targets for environmental protection, innovation and self-sufficient development (Roberts, 2020cRoberts, M. (2020a). China: Three models of development. Austrian Journal of Development Studies, 37(1), 10-39.). This is all part of the strategy of developing a “dual circulation” economy in which China will develop domestic demand and self-sufficiency while the rest of the world remains stalled by coronavirus and economic crises (Roberts, 2020bRoberts, M. (2020a). China: Three models of development. Austrian Journal of Development Studies, 37(1), 10-39.). China’s leaders are determined to resist the new policy of “containment” emanating from the “liberal democracies”. The trade, technology and political “cold war” is set to heat up over the rest of this decade, while the planet heats up too (Roberts, 2020cRoberts, M. (2020a). China: Three models of development. Austrian Journal of Development Studies, 37(1), 10-39.).
But as the components of a transitional economy from capitalism to socialism reveal, this qualitative change does not mean or guarantee that China will progress “towards socialism”, as the experience of the 70 years of the Soviet Union confirms. China is still far away from that. Indeed, the forces of imperialism from without and of the law of value within from domestic capitalist sectors suggest that China is in a “trapped transition” which could eventually be reversed, as it proved for the Soviet Union. That can only be avoided if transitional economies emerge in other key countries globally.